

Question: The table below summarizes how consumers reacts to the changes of the price of gasoline. For instance, if the price of gas is $2.00 per
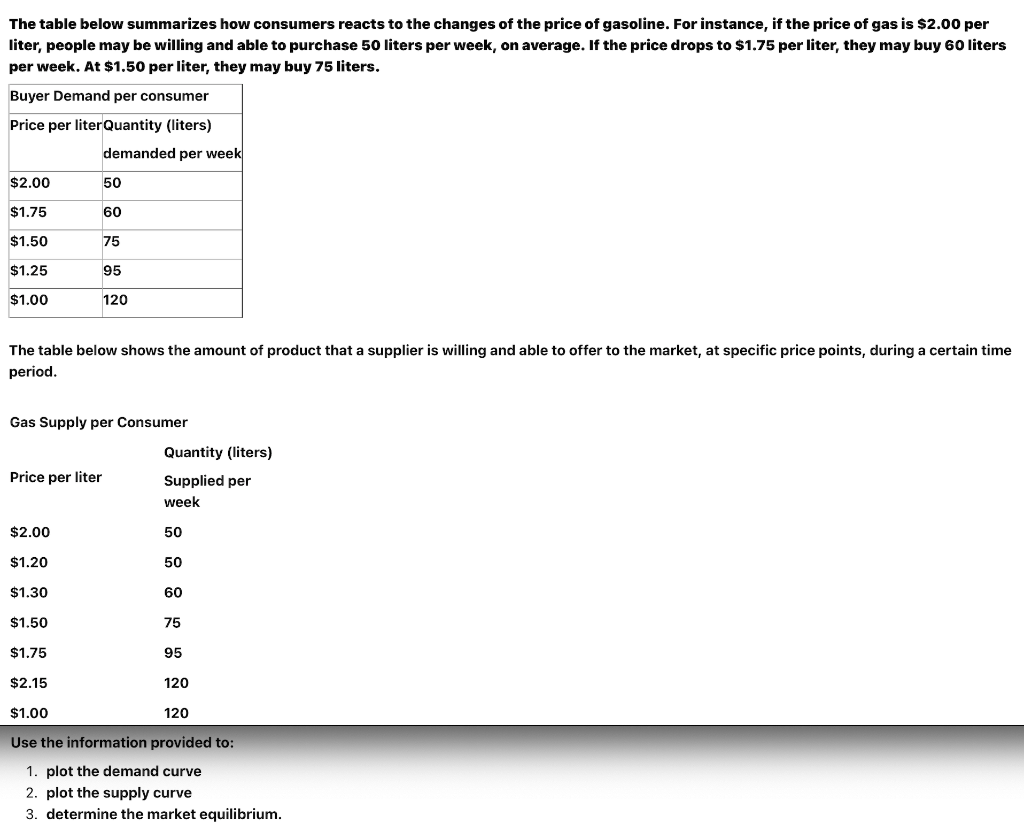
The table below summarizes how consumers reacts to the changes of the price of gasoline. For instance, if the price of gas is $2.00 per liter, people may be willing and able to purchase 50 liters per week, on average. If the price drops to $1.75 per liter, they may buy 60 liters per week. At $1.50 per liter, they may buy 75 liters. Buyer Demand per consumer Price per liter Quantity (liters) demanded per week $2.00 50 $1.75 60 $1.50 75 $1.25 95 $1.00 120 The table below shows the amount of product that a supplier is willing and able to offer to the market, at specific price points, during a certain time period. Gas Supply per Consumer Price per liter Quantity (liters) Supplied per week $2.00 50 $1.20 50 $1.30 60 $1.50 75 $1.75 95 $2.15 120 $1.00 120 Use the information provided to: 1. plot the demand curve 2. plot the supply curve 3. determine the market equilibrium
Step by Step Solution
There are 3 Steps involved in it

Get step-by-step solutions from verified subject matter experts