

Question: The table below summarizes observed counts, expected counts, and standardized residuals, for income (rows) and perceived happiness (columns). Above average Not too happy Pretty
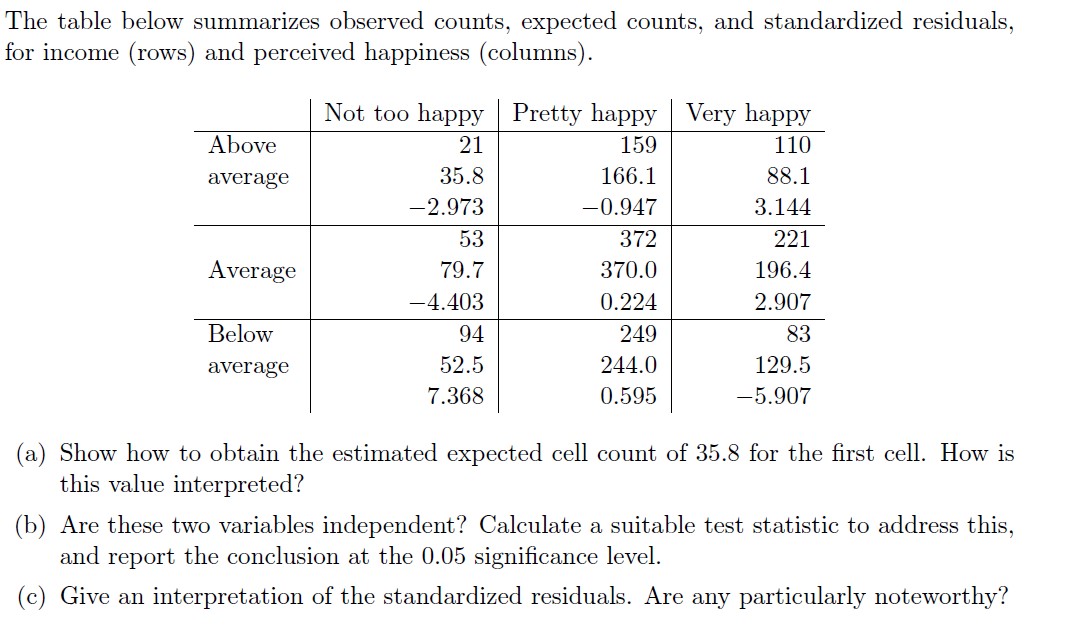
The table below summarizes observed counts, expected counts, and standardized residuals, for income (rows) and perceived happiness (columns). Above average Not too happy Pretty happy Very happy 21 159 110 35.8 166.1 88.1 -2.973 -0.947 3.144 53 372 221 Average 79.7 370.0 196.4 -4.403 0.224 2.907 Below 94 249 83 average 52.5 7.368 244.0 0.595 129.5 -5.907 (a) Show how to obtain the estimated expected cell count of 35.8 for the first cell. How is this value interpreted? (b) Are these two variables independent? Calculate a suitable test statistic to address this, and report the conclusion at the 0.05 significance level. (c) Give an interpretation of the standardized residuals. Are any particularly noteworthy?
Step by Step Solution
There are 3 Steps involved in it

Get step-by-step solutions from verified subject matter experts