

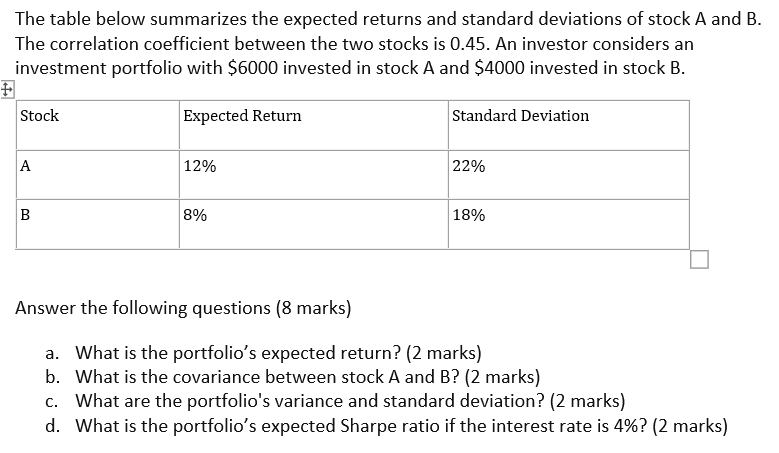
Question: The table below summarizes the expected returns and standard deviations of stock A and B. The correlation coefficient between the two stocks is 0.45. An
Step by Step Solution
There are 3 Steps involved in it
1 Expert Approved Answer
Step: 1 Unlock

Question Has Been Solved by an Expert!
Get step-by-step solutions from verified subject matter experts
Step: 2 Unlock
Step: 3 Unlock