Question: The table below (table 3) demonstrates the relative risk (RR) and 95% CI for incident ischemic stroke by quintile of grain consumption in the prospective
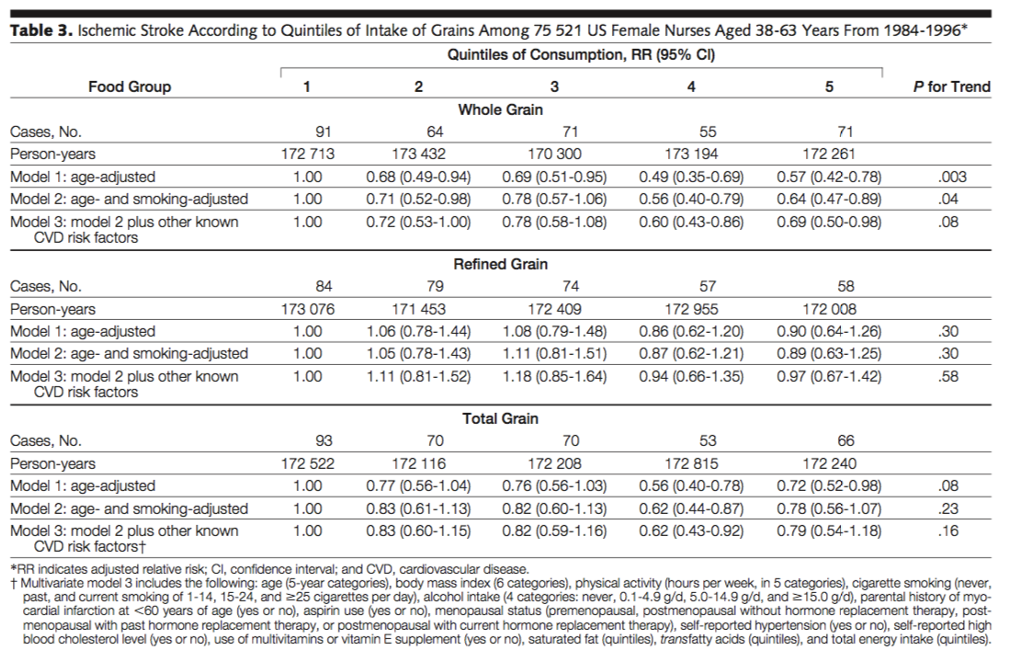
The table below (table 3) demonstrates the relative risk (RR) and 95% CI for incident ischemic stroke by quintile of grain consumption in the prospective Nurses' Health Study. Use the table to answer the following questions:
a.Looking at model 3, what is the association between "Whole grain", "Refined grain" and "Total grain", respectively, and ischemic heart disease, comparing the results of quintile 5 versus quintile 1? Using full sentences, please comment on the direction and magnitude of any significant associations you identify (for non-significant associations, you can simply state that there is no association). (3pts)
b.Is the p for trend significant for model 3 for "whole grain", "refined grain" and "total grain"? What does this indicate? (3pts)
c. Based on these findings, what public health recommendations would you make regarding grain consumption in the context of ischemic heart disease among women? Motivate your answer. Please do not simply restate the results, I want to know what you think the public health implications of the results should be.
Table 3. Ischemic Stroke According to Quintiles of Intake of Grains Among 75 521 US Female Nurses Aged 38-63 Years From 1984-1996* Quintiles of Consumption, RR (95% CI) Food Group 2 3 4 5 P for Trend Whole Grain Cases, No. 91 64 71 55 71 Person-years 172 713 173 432 170 300 173 194 172 261 Model 1: age-adjusted 1.00 0.68 (0.49-0.94) 0.69 (0.51-0.95) 0.49 (0.35-0.69) 0.57 (0.42-0.78) 003 Model 2: age- and smoking-adjusted 1.00 0.71 (0.52-0.98) 0.78 (0.57-1.06 0.56 (0.40-0.79) 0.64 (0.47-0.89) 04 Model 3: model 2 plus other known 1.00 0.72 (0.53-1.00) 0.78 (0.58-1.08) 0.60 (0.43-0.86) 0.69 (0.50-0.98) 08 CVD risk factors Refined Grain Cases, No. 84 79 74 57 58 Person-years 173 076 171 453 172 409 172 955 172 008 Model 1: age-adjusted 1.00 1.06 (0.78-1.44) 1.08 (0.79-1.48) 0.86 (0.62-1.20) 0.90 (0.64-1.26) 30 Model 2: age- and smoking-adjusted 1.00 1.05 (0.78-1.43) 1.11 (0.81-1.51) 0.87 (0.62-1.21) 0.89 (0.63-1.25) 30 Model 3: model 2 plus other known 1.00 1.11 (0.81-1.52) 1.18 (0.85-1.64) 0.94 (0.66-1.35) 0.97 (0.67-1.42) 58 CVD risk factors Total Grain Cases, No. 93 70 70 53 66 Person-years 172 522 172 116 172 208 172 815 172 240 Model 1: age-adjusted 1.00 0.77 (0.56-1.04) 0.76 (0.56-1.03) 0.56 (0.40-0.78) 0.72 (0.52-0.98) 08 Model 2: age- and smoking-adjusted 1.00 0.83 (0.61-1.13) 0.82 (0.60-1.13) 0.62 (0.44-0.87) 0.78 (0.56-1.07) .23 Model 3: model 2 plus other known 1.00 0.83 (0.60-1.15) 0.82 (0.59-1.16) 0.62 (0.43-0.92) 0.79 (0.54-1.18) .16 CVD risk factorst *RR indicates adjusted relative risk; Cl, confidence interval; and CVD, cardiovascular disease. + Multivariate model 3 includes the following: age (5-year categories), body mass index (6 categories), physical activity (hours per week, in 5 categories), cigarette smoking (never, past, and current smoking of 1-14, 15-24, and >25 cigarettes per day), alcohol intake (4 categories: never, 0.1-4.9 g/d, 5.0-14.9 g/d, and >15.0 g/d), parental history of myo- cardial infarction at
Step by Step Solution
There are 3 Steps involved in it
1 Expert Approved Answer
Step: 1 Unlock
Question Has Been Solved by an Expert!
Get step-by-step solutions from verified subject matter experts
Step: 2 Unlock
Step: 3 Unlock
Students Have Also Explored These Related Mathematics Questions!