

Question: The table below was obtained by using data for 40 males. The response (y) variable is weight (in pounds), and the predictor (x) variables are
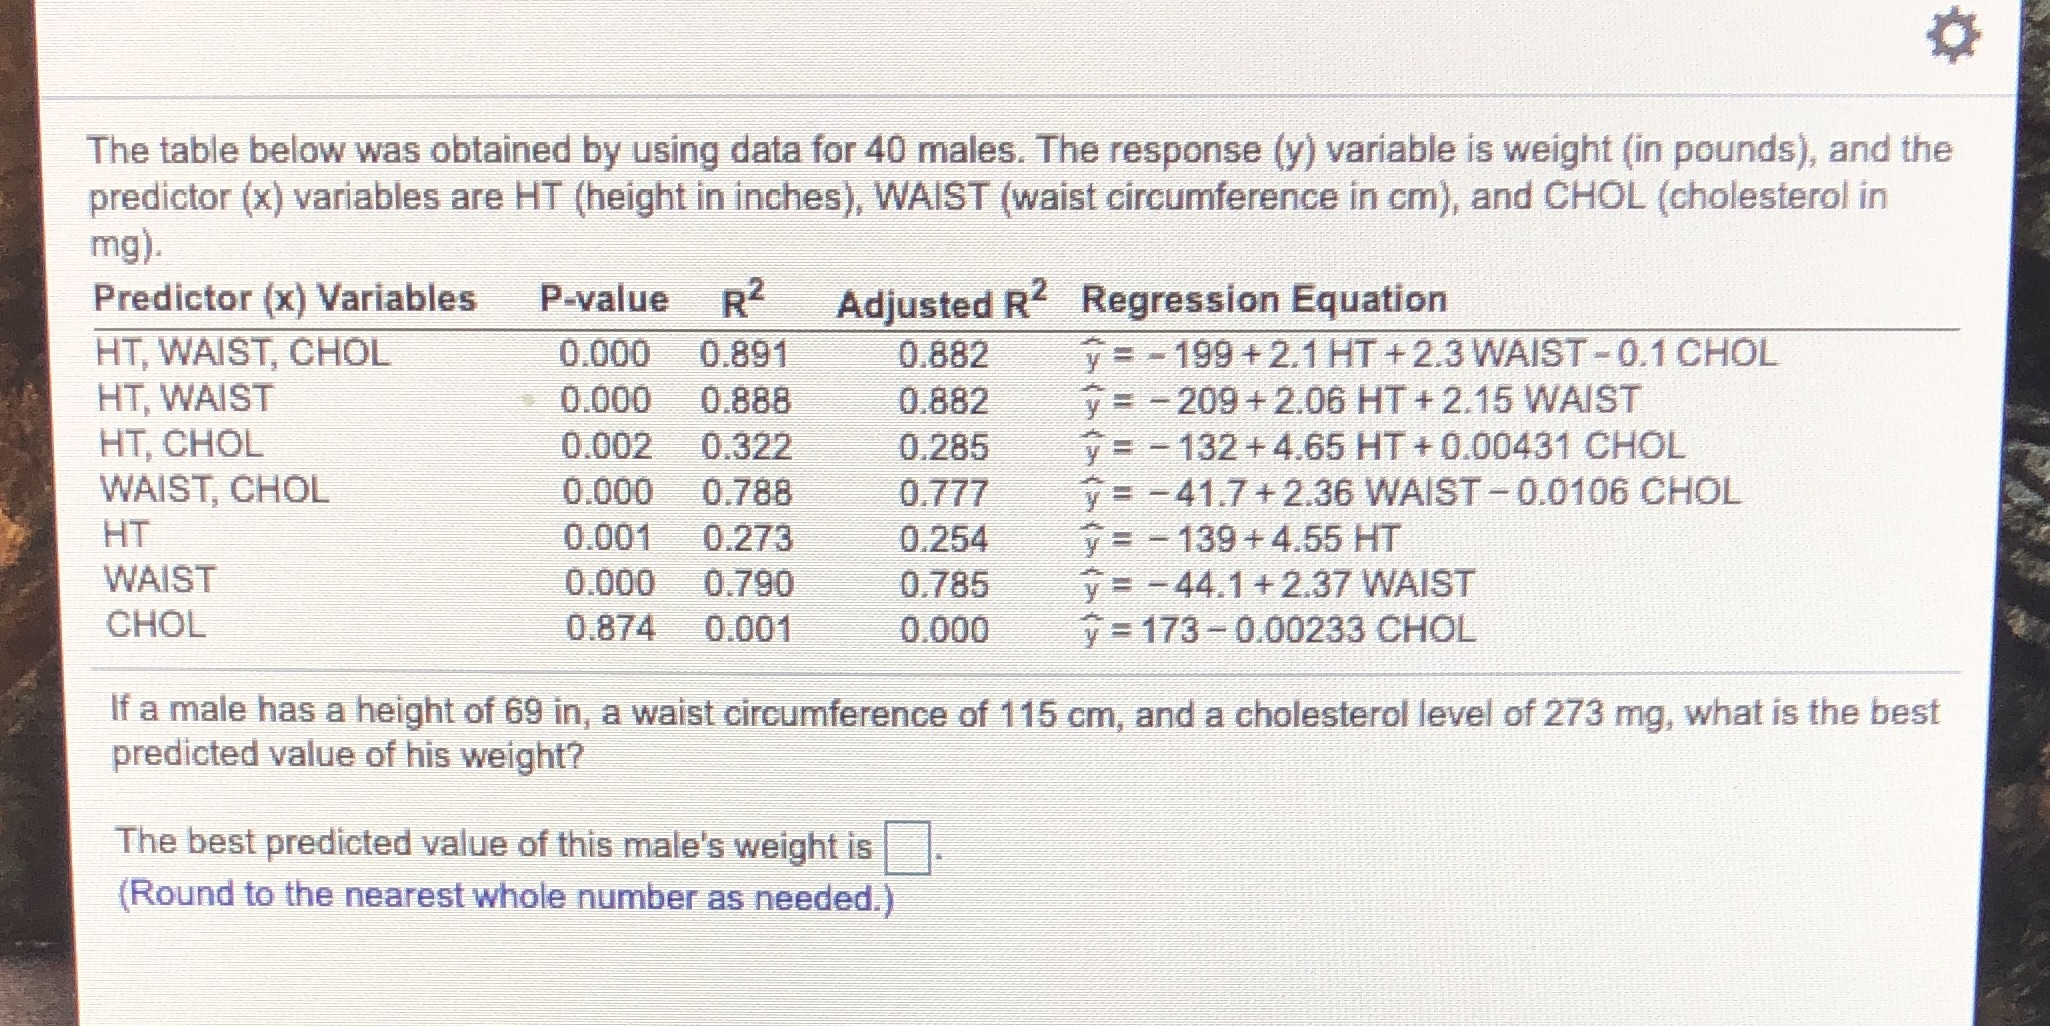
The table below was obtained by using data for 40 males. The response (y) variable is weight (in pounds), and the predictor (x) variables are HT (height in inches), WAIST (waist circumference in cm), and CHOL (cholesterol in mg). Predictor (x) Variables P-value R2 Adjusted R Regression Equation HT, WAIST, CHOL 0.000 0.891 0.882 y = - 199 + 2.1 HT +2.3 WAIST-0.1 CHOL HT, WAIST 0.000 0.888 0.882 y = - 209 + 2.06 HT + 2.15 WAIST HT, CHOL 0.002 0.322 0.285 y = - 132 + 4.65 HT + 0.00431 CHOL WAIST, CHOL 0.000 0.788 0.777 y = -41.7+2.36 WAIST - 0.0106 CHOL HT 0.001 0.273 0.254 y = - 139 + 4.55 HT WAIST 0.000 0.790 0.785 y = - 44.1 + 2.37 WAIST CHOL 0.874 0.001 0.000 y = 173- 0.00233 CHOL If a male has a height of 69 in, a waist circumference of 115 cm, and a cholesterol level of 273 mg, what is the best predicted value of his weight? The best predicted value of this male's weight is (Round to the nearest whole number as needed.)
Step by Step Solution
There are 3 Steps involved in it

Get step-by-step solutions from verified subject matter experts