

Question: The table below will be used for the following ve questions. The table represents the mean and standard deviation graduation rates, by candidate age, for
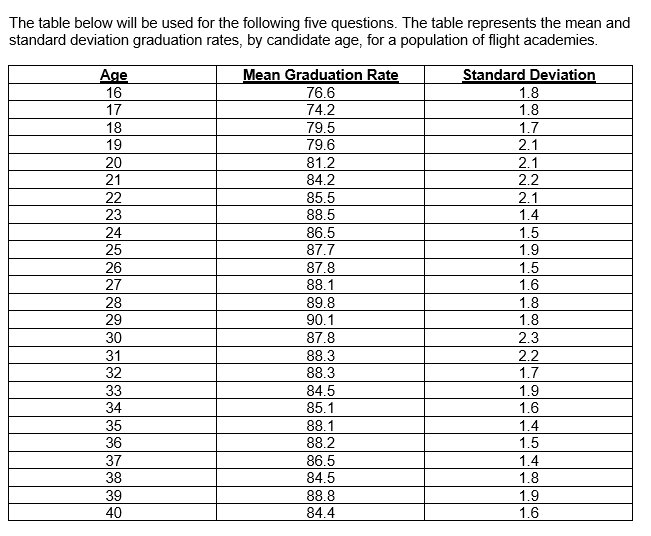
The table below will be used for the following ve questions. The table represents the mean and standard deviation graduation rates, by candidate age, for a population of ight academies. _-1'__'
Step by Step Solution
There are 3 Steps involved in it
1 Expert Approved Answer
Step: 1 Unlock

Question Has Been Solved by an Expert!
Get step-by-step solutions from verified subject matter experts
Step: 2 Unlock
Step: 3 Unlock