

Question: The table contains data for 10 randomly chosen winter days in Denver, CO and another 10 randomly selected days in Englewood, CO. The data is
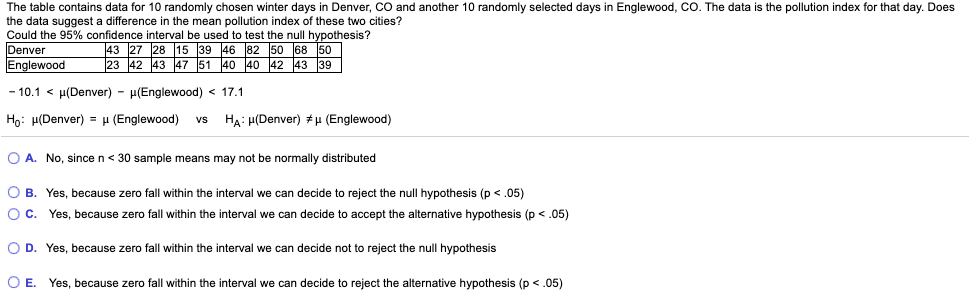
The table contains data for 10 randomly chosen winter days in Denver, CO and another 10 randomly selected days in Englewood, CO. The data is the pollution index for that day. Does the data suggest a difference in the mean pollution index of these two cities? Could the 95% confidence interval be used to test the null hypothesis? Denver 43 27 28 15 39 46 82 50 68 50 Englewood 23 42 43 47 51 40 40 42 43 39 - 10.1
Step by Step Solution
There are 3 Steps involved in it
1 Expert Approved Answer
Step: 1 Unlock

Question Has Been Solved by an Expert!
Get step-by-step solutions from verified subject matter experts
Step: 2 Unlock
Step: 3 Unlock