

Question: The table contains the After-tax Operating Return on Assets Analysis of Molson Coors. Use the values and its changes to explain R*t and its
The table contains the After-tax Operating Return on Assets Analysis of Molson Coors.
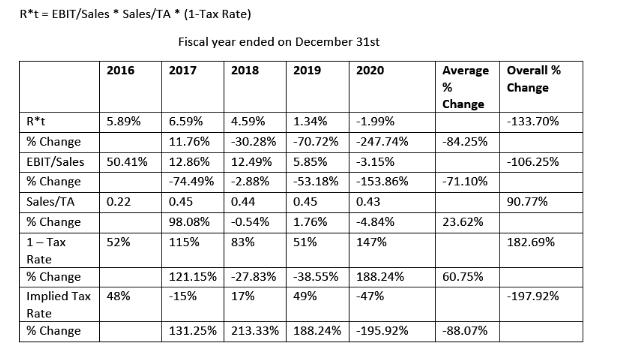
Use the values and its changes to explain R*t and its changes from 2016 to 2020. Then discuss any trends, major causes or general conclusions.
R*t = EBIT/Sales* Sales/TA* (1-Tax Rate) R*t % Change EBIT/Sales % Change Sales/TA % Change 1- Tax Rate % Change Implied Tax Rate % Change 2016 5.89% 50.41% 0.22 52% 48% Fiscal year ended on December 31st 2020 2017 2018 6.59% 4.59% 11.76% -30.28% 12.86% 12.49% -74.49% -2.88% 0.45 0.44 98.08% -0.54% 115% 83% 121.15% -15% -27.83% 17% 2019 1.34% -1.99% -70.72% -247.74% -3.15% -153.86% 5.85% -53.18% 0.45 1.76% 51% -38.55% 49% 131.25% 213.33% 188.24% 0.43 -4.84% 147% 188.24% -47% -195.92% Average % Change -84.25% -71.10 % 23.62% 60.75% -88.07% Overall % Change -133.70% -106.25% 90.77% 182.69% -197.92%
Step by Step Solution
3.56 Rating (153 Votes )
There are 3 Steps involved in it
Solution To understand the changes in Rt Aftertax Operating Return on Assets from 2016 to 2020 for Molson Coors we will break down the provided data and analyze the trends and major causes R t is calc... View full answer

Get step-by-step solutions from verified subject matter experts