The Table gives the Natural and Actual Rate of Unemployment for all significant Peaks and Troughs since
Question:
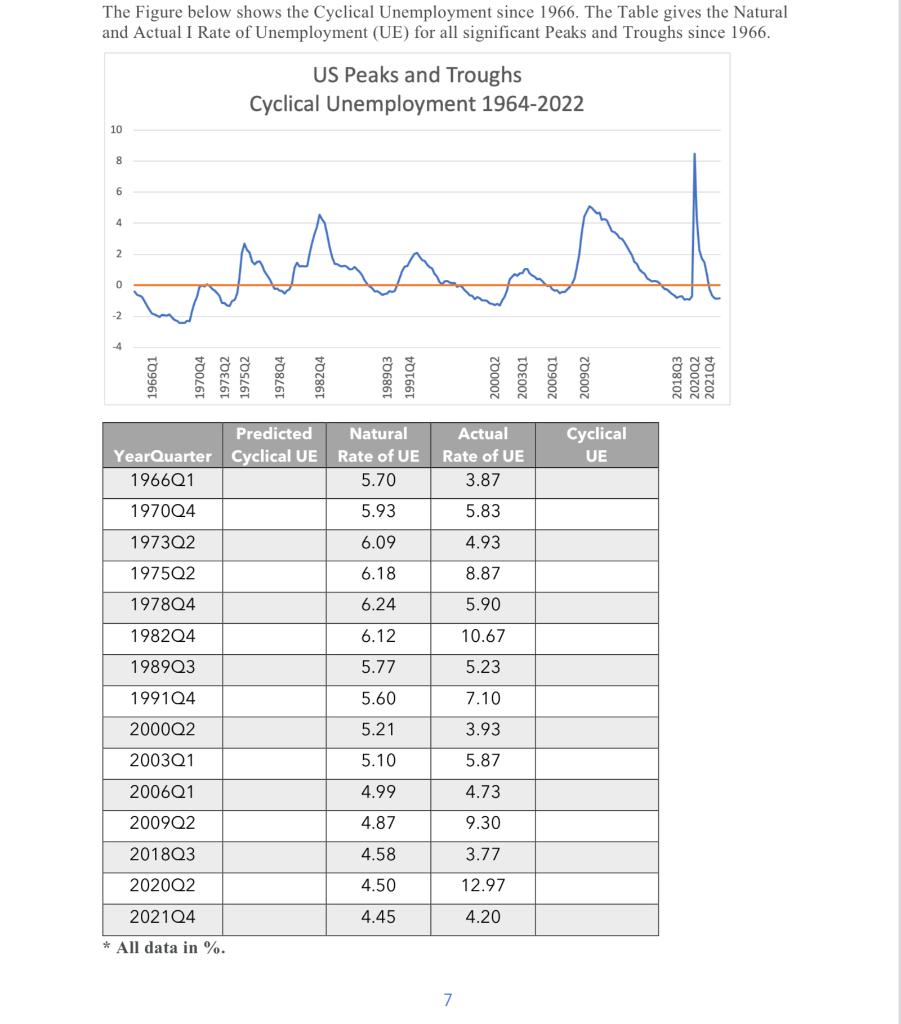
The Table gives the Natural and Actual Rate of Unemployment for all significant Peaks and Troughs since 1966.
Using the Okun's Law, fill in the second column ("Predicted Cyclical Unemployment") in the table using output gap calculations [in percent units and rounded to the nearest 100thof a percent].
Using the data in the table, compute actual cyclical unemployment rate to fill in the last column of the table [in percent units and rounded to the nearest 100thof a percent].(g) Compute cyclical unemployment from the data given in the table above to fill in the last column. How does your prediction in (f) compare to the data on cyclical unemployment? Briefly describe. [Hint: does the prediction get the sign correctly? How far off is the prediction (e.g., within 1 percentage point or not)?] (3 points)
Expert Answer:
The cyclical unemployment rate is the difference between the actual unemployment rate and the natura... View the full answer