

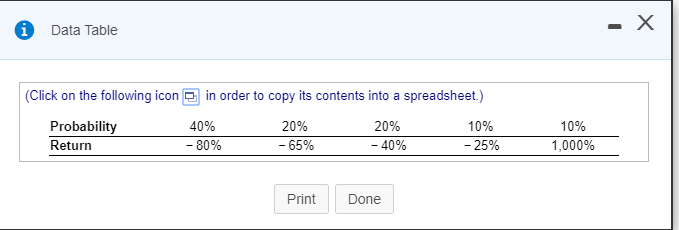
Question: The table here, (Data Table below)..., shows the one-year return distribution of Startup Inc. Calculate the: a. Expected return. b. The standard deviation of the
The table here, (Data Table below)..., shows the one-year return distribution of Startup Inc. Calculate the:
a. Expected return.
b. The standard deviation of the return.
The expected return is %. (Round to one decimal place.)
i Data Table (Click on the following icon Probability Return in order to copy its contents into a spreadsheet.) 40% 20% 20% 10% -80% -65% -40% - 25% 10% 1,000% Print Done
Step by Step Solution
There are 3 Steps involved in it
1 Expert Approved Answer
Step: 1 Unlock

Question Has Been Solved by an Expert!
Get step-by-step solutions from verified subject matter experts
Step: 2 Unlock
Step: 3 Unlock