

Question: The table lists the average monthly cost to workers for family health insurance for various years. a) Use a graphing calculator to fit a
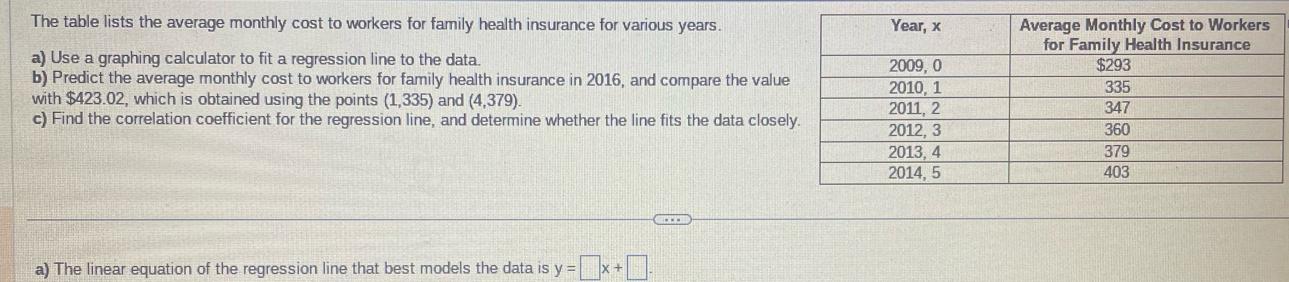
The table lists the average monthly cost to workers for family health insurance for various years. a) Use a graphing calculator to fit a regression line to the data. b) Predict the average monthly cost to workers for family health insurance in 2016, and compare the value with $423.02, which is obtained using the points (1,335) and (4,379). c) Find the correlation coefficient for the regression line, and determine whether the line fits the data closely. y=x+0. a) The linear equation of the regression line that best models the data is y = EXTE Year, x 2009, 0 2010, 1 2011, 2 2012, 3 2013, 4 2014, 5 Average Monthly Cost to Workers for Family Health Insurance $293 335 347 360 379 403
Step by Step Solution
3.40 Rating (150 Votes )
There are 3 Steps involved in it
Solution Answer ... View full answer

Get step-by-step solutions from verified subject matter experts