

Question: The table provided below shows paired data tor The heights of a certain country's presidents and their main opponents in The election campaign. Construct a
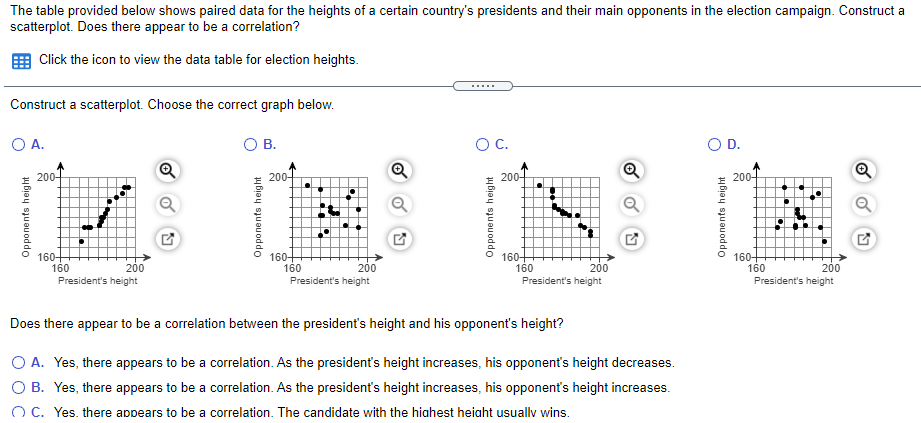
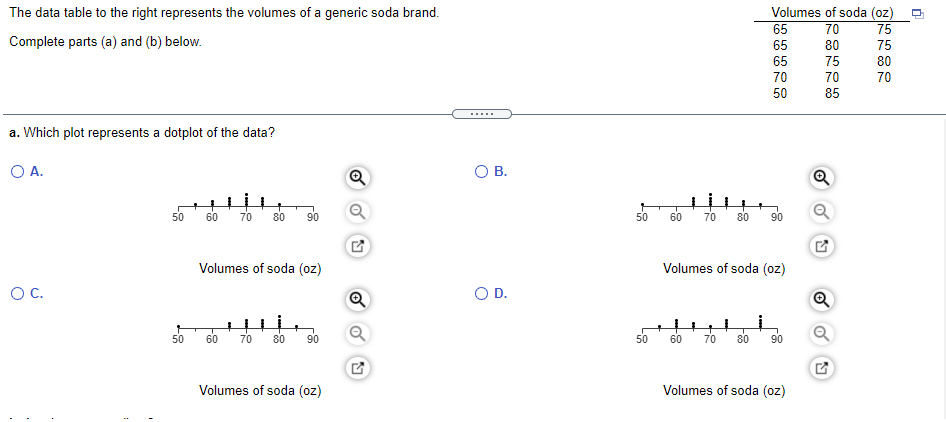
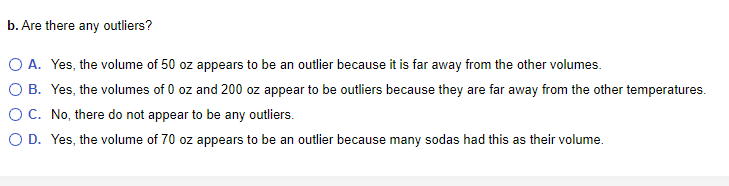
The table provided below shows paired data tor The heights of a certain country's presidents and their main opponents in The election campaign. Construct a scatterplot. Does there appear to be a correlation? a Click the icon to View the data table for election heights. 1: Construct a scatterplot. Choose The correct graph below. 0 A. O B. O C. O D. I. E zoo Q E 20 Q E 20 Q E as .E\" .E\" .E\" .E\" II II I! I! 1-: Q 1-: Q E Q E I: I: I: I: E E . E E s G s G 5': r3 5': o 160 h o 16 h D 16 h D 16 160 200 160 200 160 200 160 2110 President's height President's height President's height President's height Does there appear to be a correlation between The president's height and his opponent's height? 0 A. Yes, there appears to be a correlation. As the president's height increases, his opponent's height decreases. O B. Yes, there appears to be a correlation. As The president's height increases, his opponent's height increases. 0 C. Yes. there aooears to be a correlation. The candidate with the hiahest heicht usuallv wins. Does There appear to be a correlation between The president's height and his opponent's height? 0 A. Yes. there appears to be a correlation. As The president's height increases, his opponent's height decreases. C} E. Yes. there appears to be a correlation. As The president's height increases, his opponent's height increases. C} C. Yes. there appears to be a correlation. The candidate 1.Irith The highest height usually Iwins. C} D. No, There does not appear to be a correlation because There is no general pattern to The data. The data table to the right represents the volumes of a generic soda brand. Volumes of soda (oz) 65 70 75 Complete parts (a) and (b) below. 65 80 75 65 75 80 70 70 70 50 85 a. Which plot represents a dotplot of the data? O A. O B. 50 60 70 80 90 50 60 70 80 90 Volumes of soda (oz) Volumes of soda (oz) OC. O OD. 50 60 90 50 60 Volumes of soda (oz) Volumes of soda (oz)b. Are there any outliers? O A. Yes, the volume of 50 oz appears to be an outlier because it is far away from the other volumes. O B. Yes, the volumes of 0 oz and 200 oz appear to be outliers because they are far away from the other temperatures. O C. No, there do not appear to be any outliers. O D. Yes, the volume of 70 oz appears to be an outlier because many sodas had this as their volume
Step by Step Solution
There are 3 Steps involved in it

Get step-by-step solutions from verified subject matter experts