

Question: The table provided to you by your instructor contains calculations of several key ratios for a fictitious company. Texanna Pharmaceutical Company, a maker of
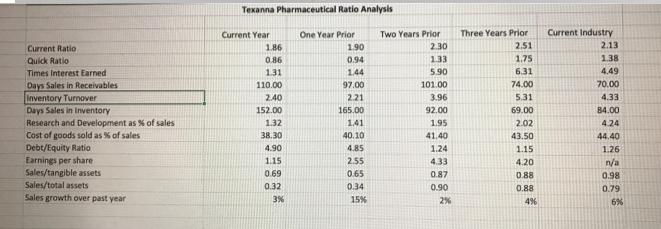
The table provided to you by your instructor contains calculations of several key ratios for a fictitious company. Texanna Pharmaceutical Company, a maker of proprietary and prescription drugs. Texanna is a small- to medium-sized publicly held pharmaceutical company. Approximately 80% of its sales has been in prescription drugs; the remaining 20% is in medical supplies over the counter. Auditor's calculations are used to ascertain potential risks in anticipation of an audit. Some of this data may indicate the need for other industry-or company-specific data. Many of the company's drugs are patented and Bamatosis' (a best seller) patent will expire in 2 years. Over the last five years, this drug alone has accounted for 20% of the company's sales. The auditor's evaluation is that the company's trends this year should be similar to the trend over the last few years and won't deviate very far from the industry norms. Your instructor will give you the financial information to use in this case. a. What financial reporting risk conclusions can you draw from this information? Pinpoint high risk of material misstatement in account balances. How will you use this risk analysis in planning the audit? Identify 4 financial reporting risks that you will address during the audit and discuss how you will address those risks. b. What other critical background information will you want to obtain when planning the audit? When performing the audit, what information do you need? Where would you get this information from? c. What significant things did the company immediately do in the preceding year? Explain. d. Examine trends in the data using Excel and highlight these trends in the ratios over the three prior years. Discuss what you noticed in the trends. Perform your analysis in Excel and your written portions in Microsoft Word. Please follow APA format, according to Current Ratio Quick Ratio Times Interest Earned Days Sales in Receivables Inventory Turnover Days Sales in Inventory Research and Development as % of sales Cost of goods sold as % of sales Debt/Equity Ratio Earnings per share Sales/tangible assets Sales/total assets Sales growth over past year Texanna Pharmaceutical Ratio Analysis Current Year 1.86 0.86 1.31 110.00 2.40 152.00 1.32 38.30 4.90 1.15 0.69 0.32 3% One Year Prior 1.90 0.94 1.44 97.00 2.21 165.00 141 40.10 4.85 2.55 0.65 0.34 15% Two Years Prior 2.30 1.33 5.90 101.00 3.96 92.00 1.95 41.40 1.24 4.33 0.87 0.90 2% Three Years Prior 2.51 1.75 6.31 74.00 5.31 69.00 2.02 43.50 1.15 4.20 0.88 0.88 4% Current Industry 2.13 1.38 4.49 70.00 4.33 84.00 4.24 44.40 1.26 n/a 0.98 0.79 6%
Step by Step Solution
3.48 Rating (158 Votes )
There are 3 Steps involved in it
Financial Reporting Risk Assessment for Texanna Pharmaceutical Company a Financial Reporting Risk Conclusions and Audit Planning High Risk of Material Misstatement Based on the information provided se... View full answer

Get step-by-step solutions from verified subject matter experts