

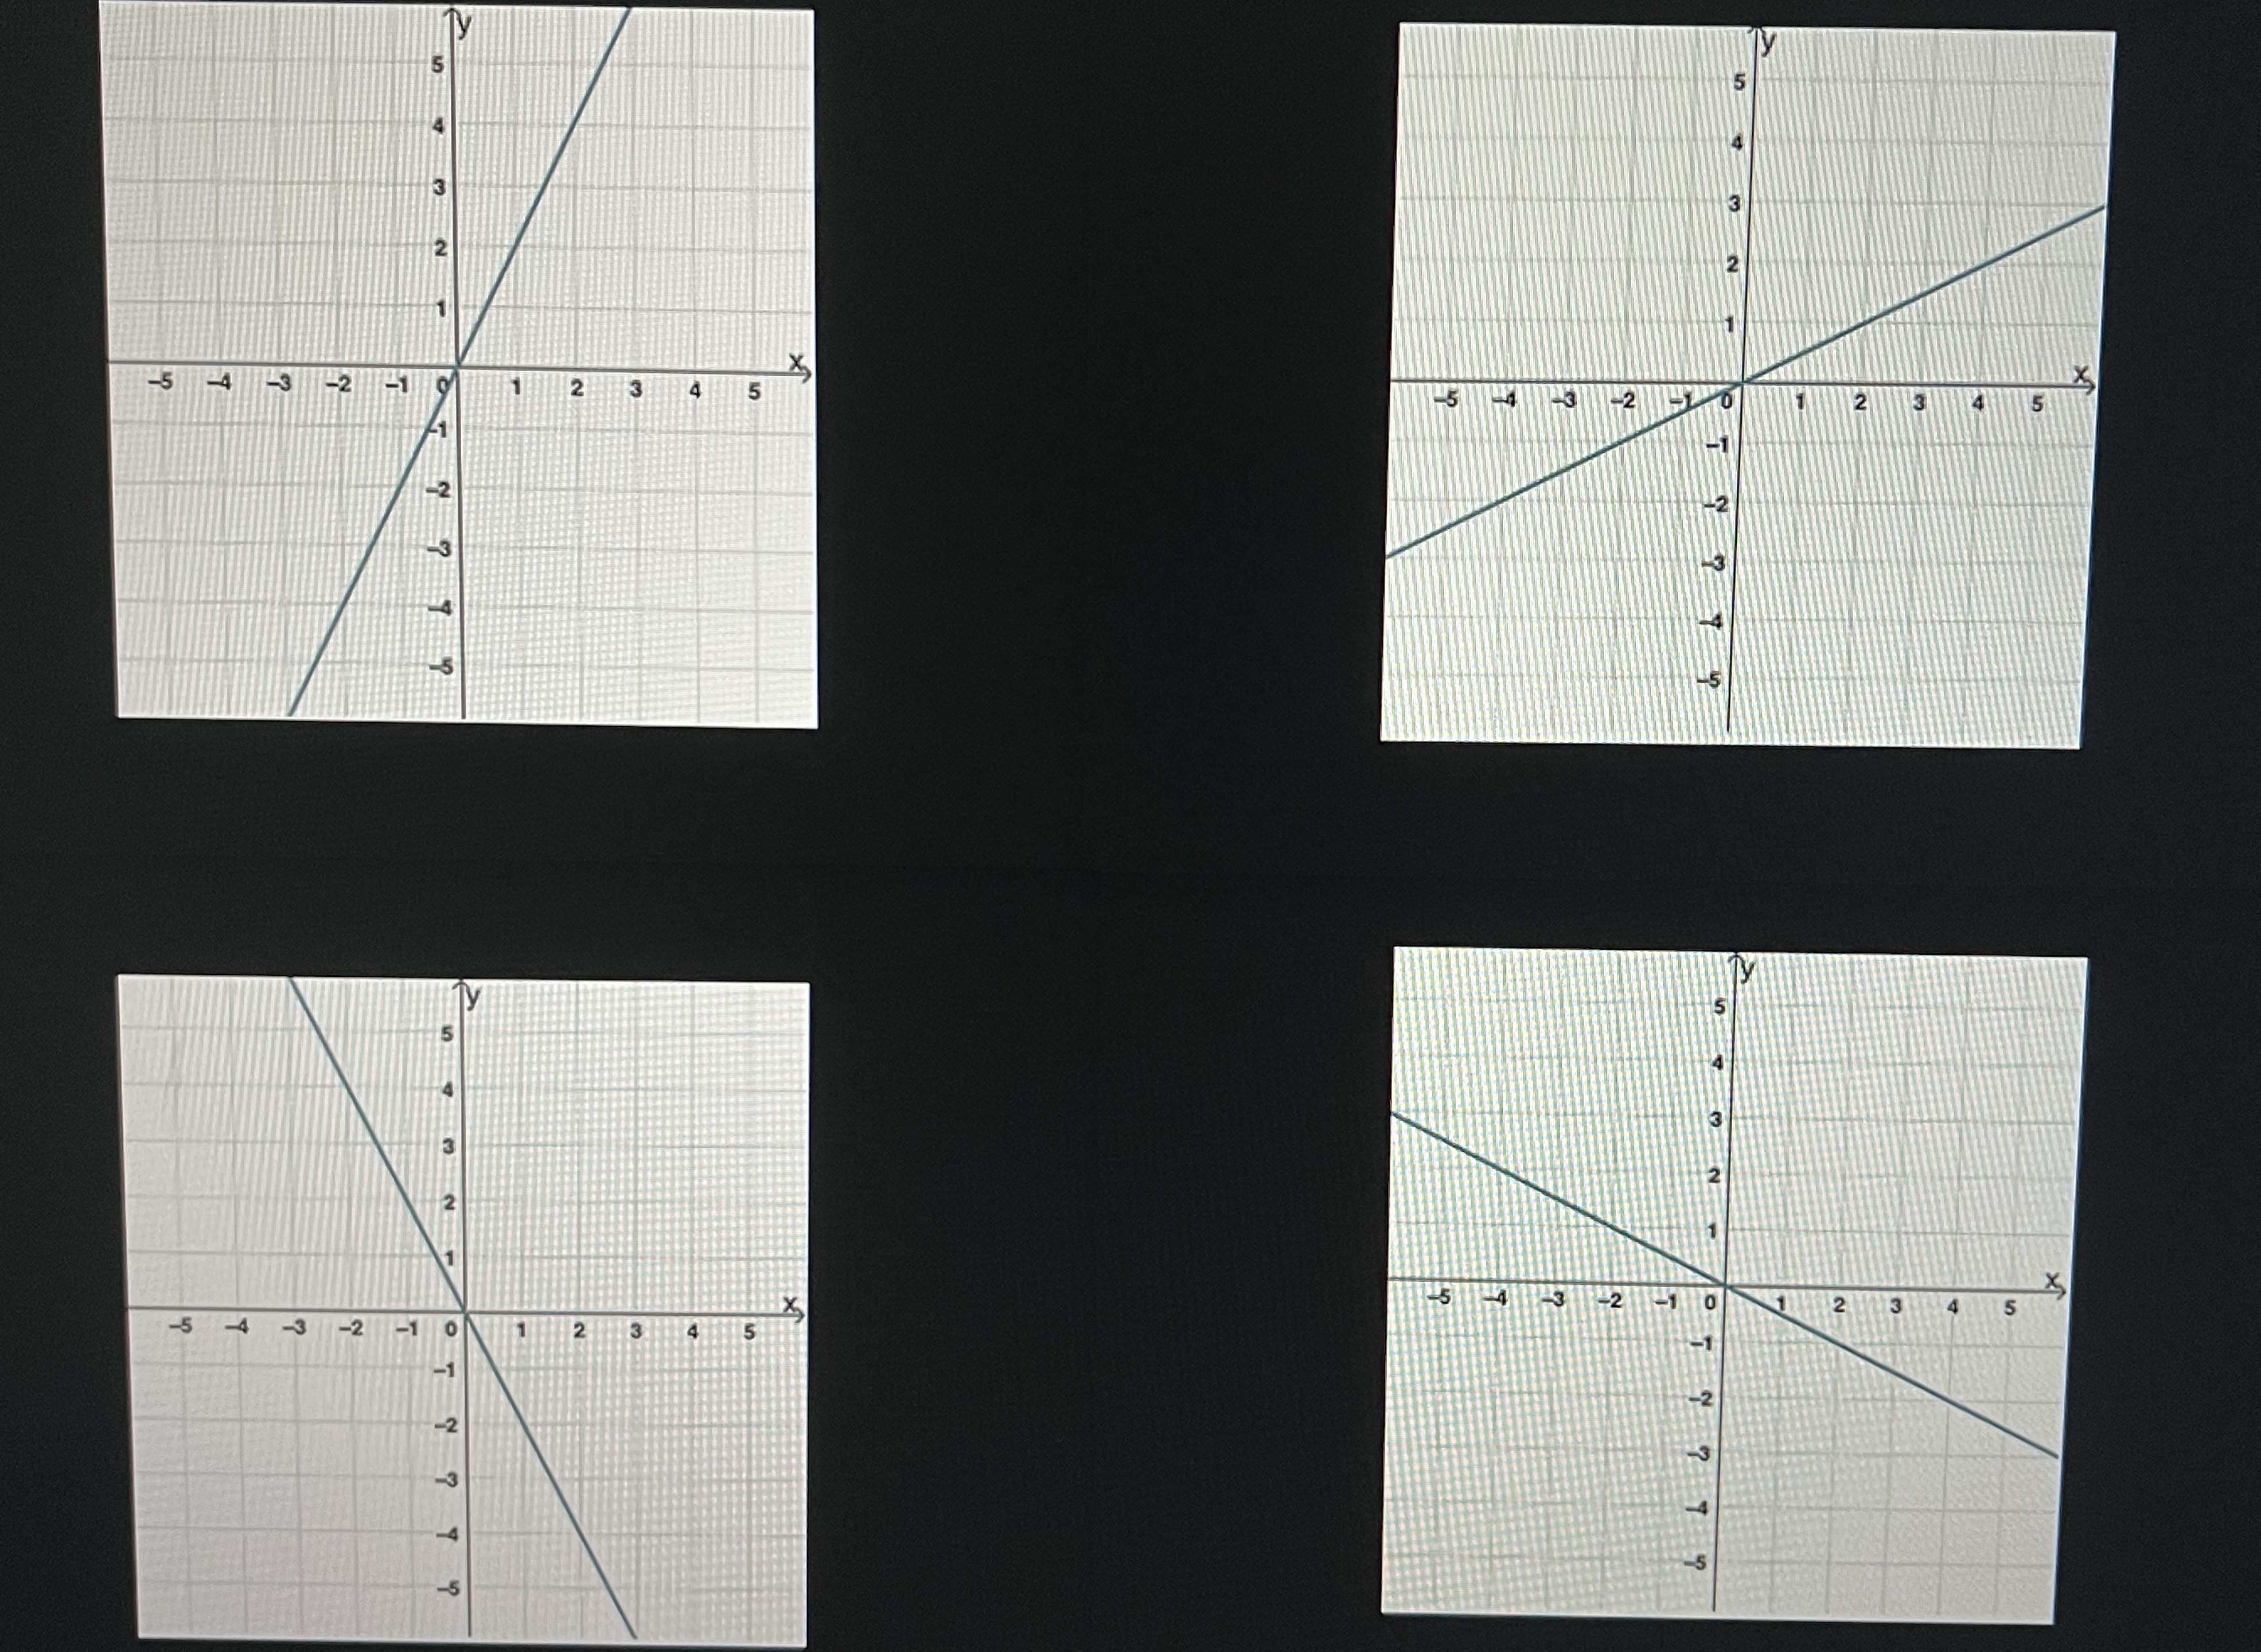
Question: The table represents a linear relationshipX -2 0 2 4y -1 0 1 2Which of the following graphs shows this relationship? N 4 15 W
The table represents a linear relationshipX -2 0 2 4y -1 0 1 2Which of the following graphs shows this relationship?
Step by Step Solution
There are 3 Steps involved in it
1 Expert Approved Answer
Step: 1 Unlock

Question Has Been Solved by an Expert!
Get step-by-step solutions from verified subject matter experts
Step: 2 Unlock
Step: 3 Unlock