

Question: The table represents a logarithmic function f(x). x y 1|5 125 2|2 2 1 14 5 10 5 1 25 |2 125 3 Use the
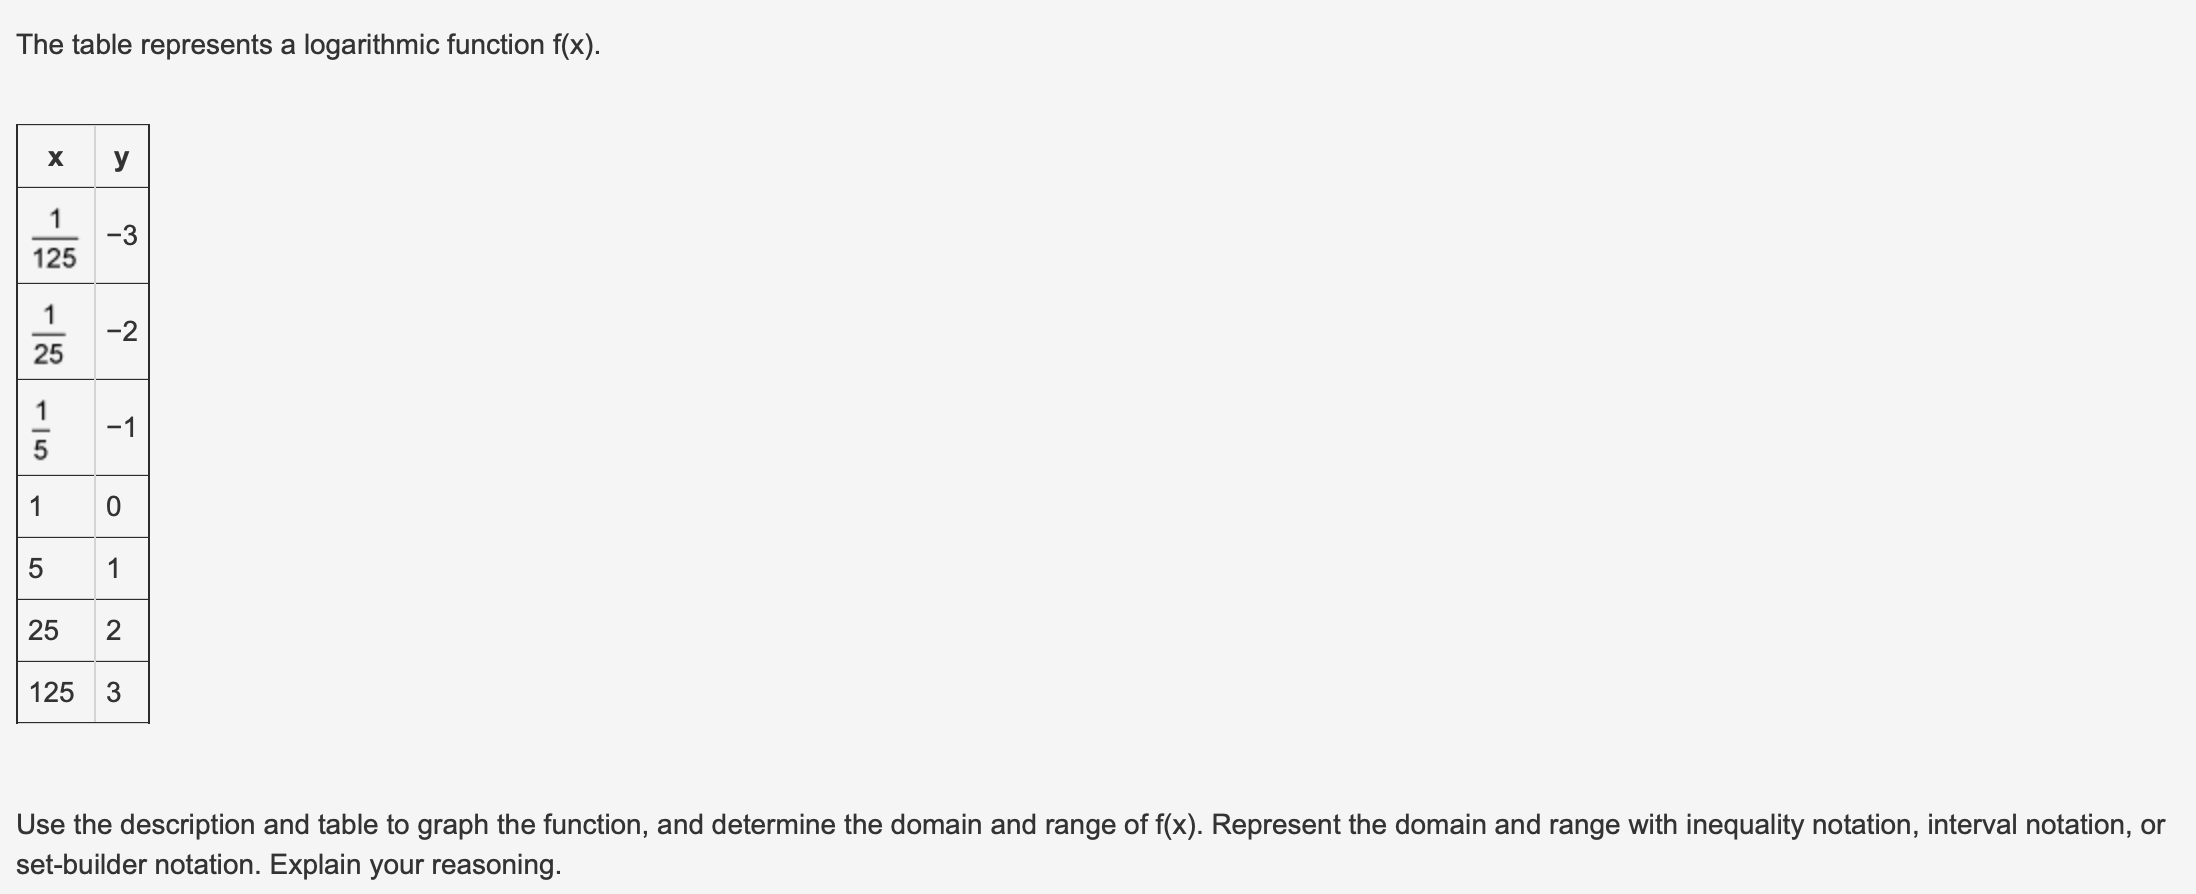


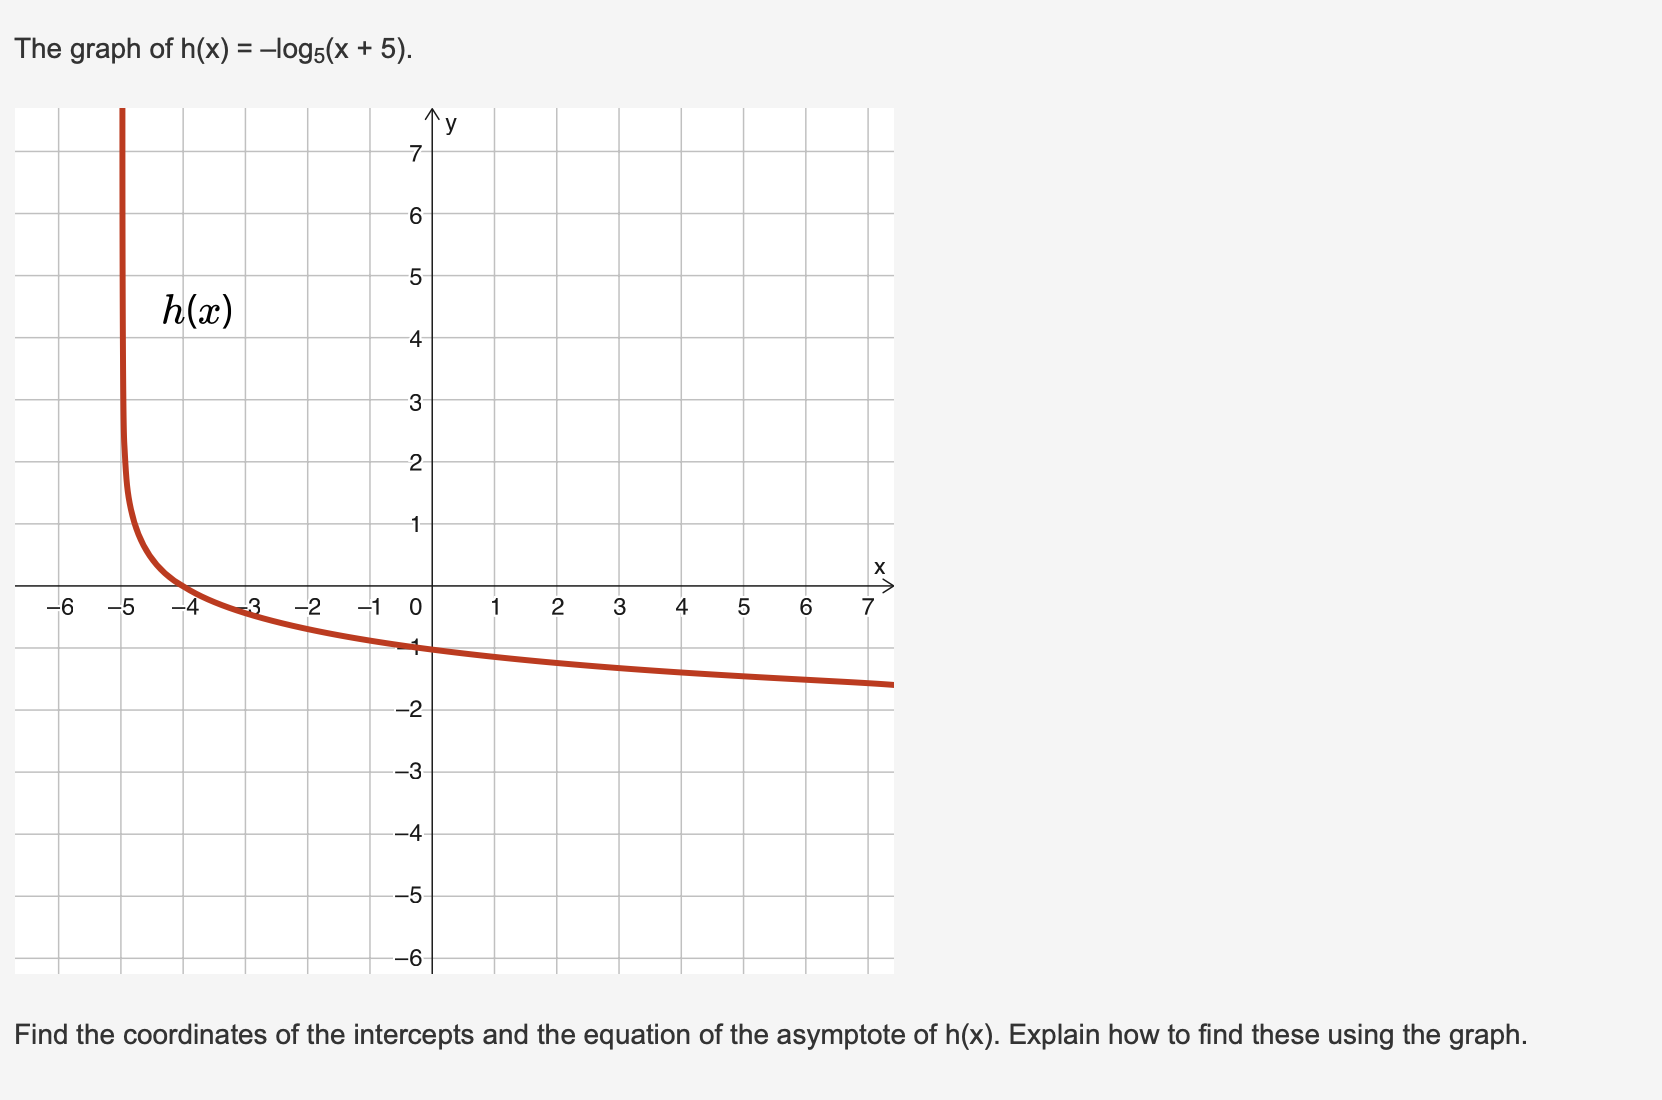
The table represents a logarithmic function f(x). x y 1|5 125 2|2 2 1 14 5 10 5 1 25 |2 125 3 Use the description and table to graph the function, and determine the domain and range of f(x). Represent the domain and range with inequality notation, interval notation, or set-builder notation. Explain your reasoning. \fThe function f(x) = log x is transformed to produce g(x) = log (x) 3. Identify the type of transformation and describe the change. The graph of h(x) = logs(x + 5). Find the coordinates of the intercepts and the equation of the asymptote of h(x). Explain how to find these using the graph
Step by Step Solution
There are 3 Steps involved in it
1 Expert Approved Answer
Step: 1 Unlock

Question Has Been Solved by an Expert!
Get step-by-step solutions from verified subject matter experts
Step: 2 Unlock
Step: 3 Unlock