

Question: The table shown in Table 3 lists dentist / patient appointment data. A patient is given an appointment at a specific time and date with
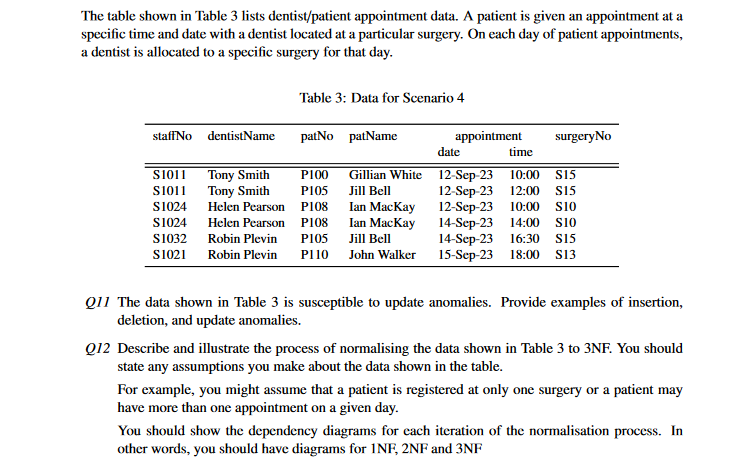
The table shown in Table lists dentistpatient appointment data. A patient is given an appointment at a
specific time and date with a dentist located at a particular surgery. On each day of patient appointments,
a dentist is allocated to a specific surgery for that day.
Table : Data for Scenario
Q The data shown in Table is susceptible to update anomalies. Provide examples of insertion,
deletion, and update anomalies.
Q Describe and illustrate the process of normalising the data shown in Table to NF You should
state any assumptions you make about the data shown in the table.
For example, you might assume that a patient is registered at only one surgery or a patient may
have more than one appointment on a given day.
You should show the dependency diagrams for each iteration of the normalisation process. In
other words, you should have diagrams for and NF
Step by Step Solution
There are 3 Steps involved in it
1 Expert Approved Answer
Step: 1 Unlock

Question Has Been Solved by an Expert!
Get step-by-step solutions from verified subject matter experts
Step: 2 Unlock
Step: 3 Unlock