

Question: The Table shows data describing a batted ball in a baseball game FEET FROM HOME PLATE || FEET IN THE AIR ( Refer to the
The Table shows data describing a batted ball in a baseball game
FEET FROM HOME PLATE || FEET IN THE AIR ( Refer to the image attached) 0 || 4 100 || 75 200 || 95 300 || 46 Question 5: The Home Run Tracker data actually describe where the ball WOULD land if nothing stopped it from reaching the ground, like a fielder, the stands, or home run fence. In the direction this particular ball was hit, the fence is 344 feet from home plate, and is 8 feet high. Did the ball clear the fence?
Note - Please provide an explanation for the steps. Please provide the graph of the function and calculation of steps.
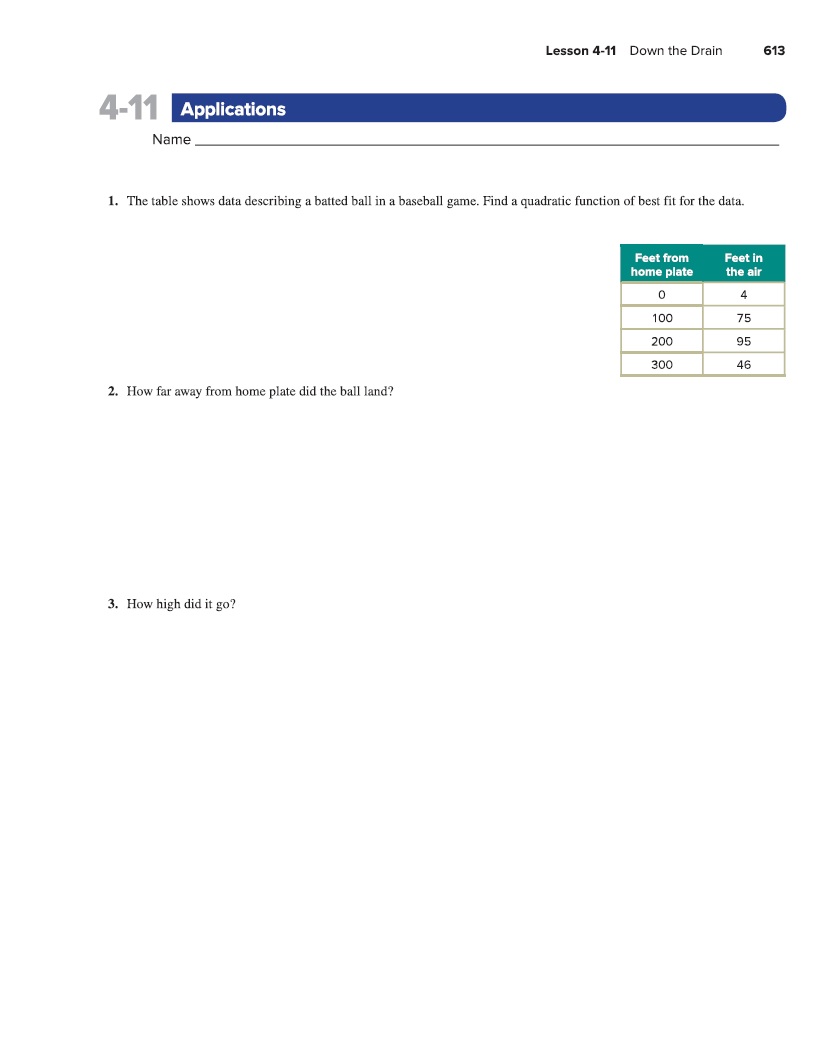
614 Unit 4 Living in a Nonlinear World 4-11 Applications Name 4. Did the ball reach its highest point exactly halfway in between where it was hit and where it landed? Should it have? Discuss, and keep in mind that the model is a parabola! 5. The Home Run Tracker data actually describes where the ball WOULD land if nothing stopped it from reaching the ground, like a fielder, the stands, or home run fence. In the direction this particular ball was hit, the fence is 344 feet from home plate, and is 8 feet high. Did the ball clear the fence? 6. Find the value of r and the residuals for your model, then use both to discuss how well you think the model fits the data.Lesson 4-11 Down the Drain 613 4-11 Applications Name 1. The table shows data describing a batted ball in a baseball game. Find a quadratic function of best fit for the data. Feet from Feet in home plate the air 4 100 75 200 95 300 46 2. How far away from home plate did the ball land? 3. How high did it go
Step by Step Solution
There are 3 Steps involved in it

Get step-by-step solutions from verified subject matter experts