

Question: The table shows data from a survey about the number of times families eat at restaurants during a week. The families are either from Rome,
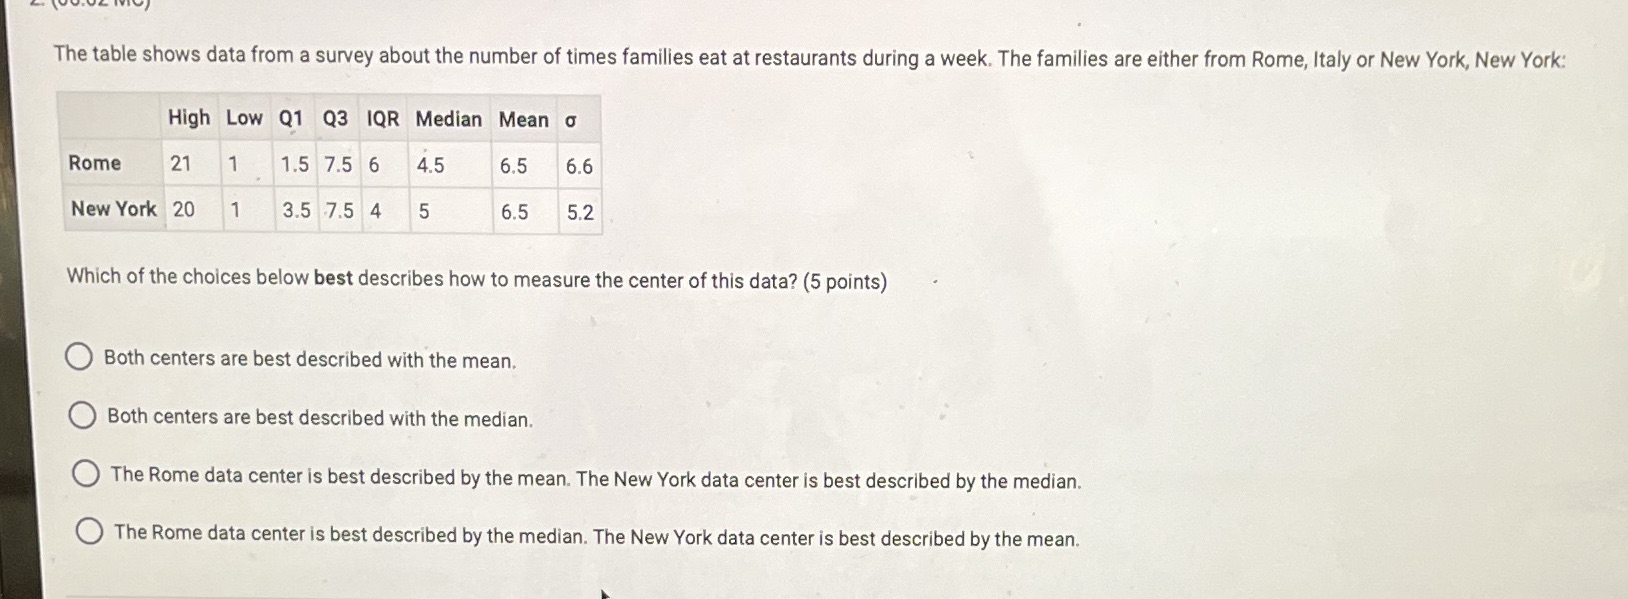
The table shows data from a survey about the number of times families eat at restaurants during a week. The families are either from Rome, Italy or New York, New York: High Low Q1 Q3 IQR Median Mean o Rome 21 1 1.5 7.5 6 4.5 6.5 6.6 New York 20 1 3.5 7.5 4 5 6.5 5.2 Which of the choices below best describes how to measure the center of this data? (5 points) Both centers are best described with the mean. Both centers are best described with the median. The Rome data center is best described by the mean. The New York data center is best described by the median. The Rome data center is best described by the median. The New York data center is best described by the mean
Step by Step Solution
There are 3 Steps involved in it

Get step-by-step solutions from verified subject matter experts