

Question: The table shows the average number 0f acres per farm in the United States for selected years. i Year 1955 1965 1975 1985 1995 2005

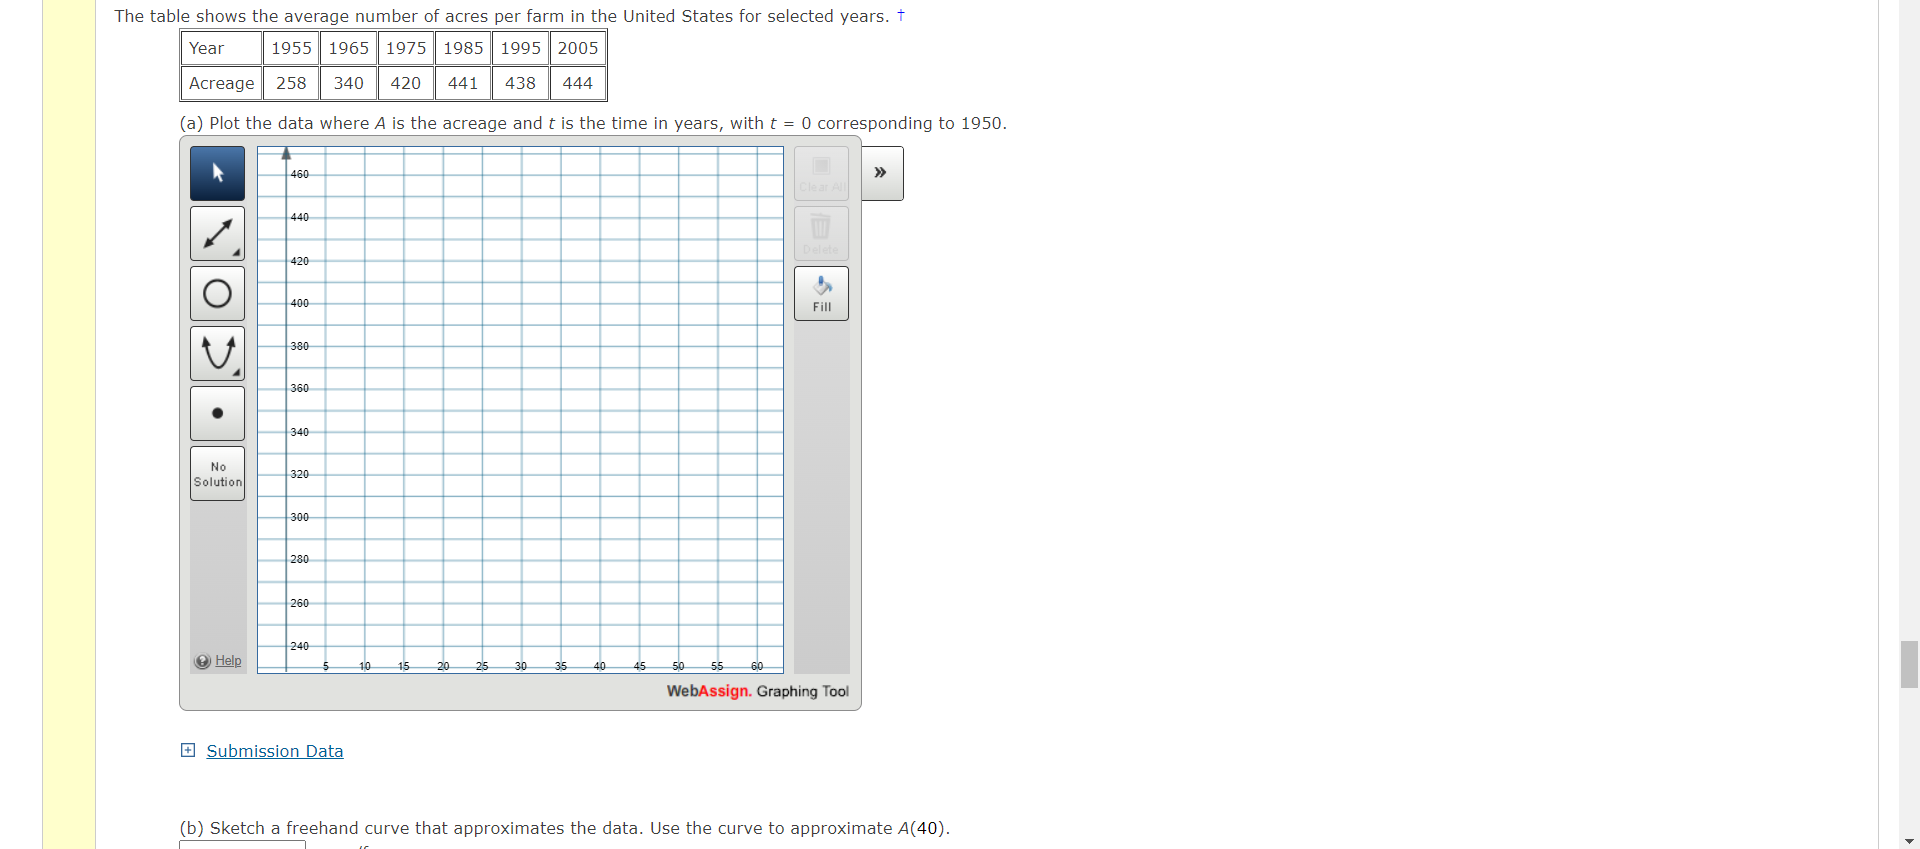
The table shows the average number 0f acres per farm in the United States for selected years. i Year 1955 1965 1975 1985 1995 2005 Acreage 2 58 340 420 441 438 444 (a) Plot the data where A is the acreage and t is the time in years, with i E 01 H E Ii E H e Submission Data = 0 corresponding to 1950. (b) Sketch a freehand curve that approximates the data. Use the curve to approximate A(40)
Step by Step Solution
There are 3 Steps involved in it
1 Expert Approved Answer
Step: 1 Unlock

Question Has Been Solved by an Expert!
Get step-by-step solutions from verified subject matter experts
Step: 2 Unlock
Step: 3 Unlock