

Question: The table shows the values found in the error analysis. What method of forecasting would be best to use? What is the forecasted value? MSE
The table shows the values found in the error analysis. What method of forecasting would be best to use? What is the forecasted value? MSE forecast for week 13 Time Series 1.08 14.76 3-week MA 3.04 13.67 exp smoothing 11.04 9.5 Group of answer choices Time Series, forecasted value = 14.76 3-week MA, forecasted value = 13.67 exp smoothing, forecasted value = 9.5 Time Series, forecasted value = 1.08 3-week MA, forecasted value = 3.04 exp smoothing, forecasted value = 11.04
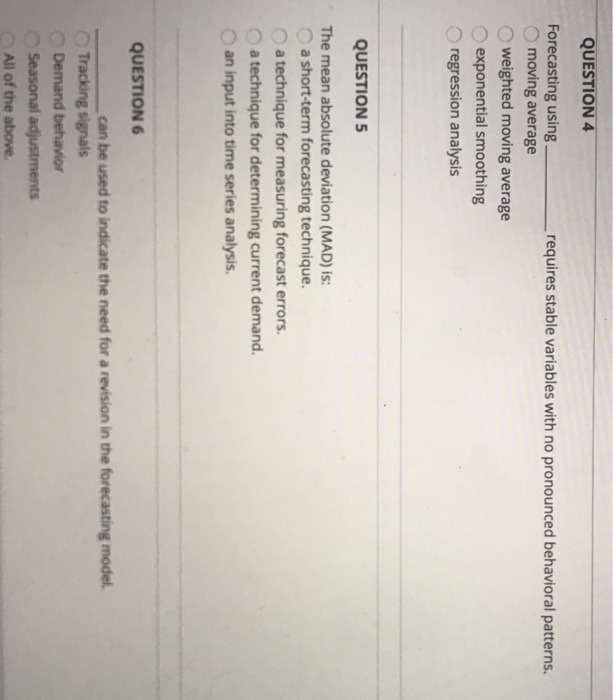
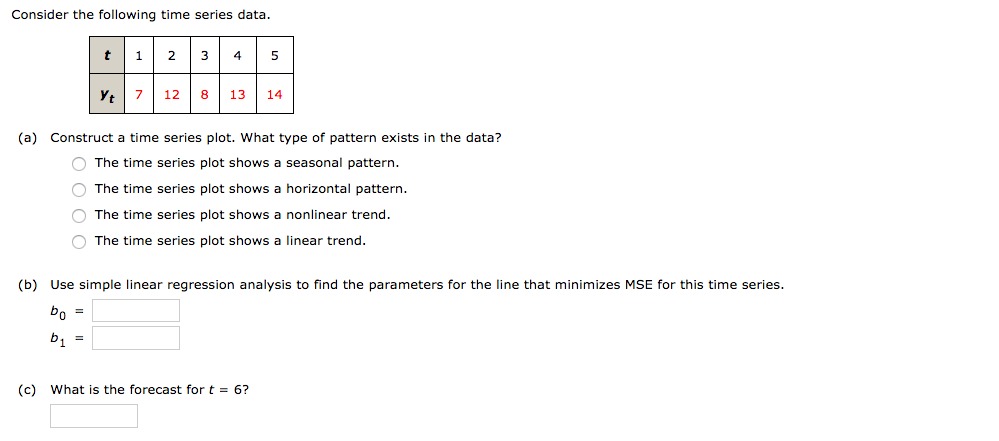
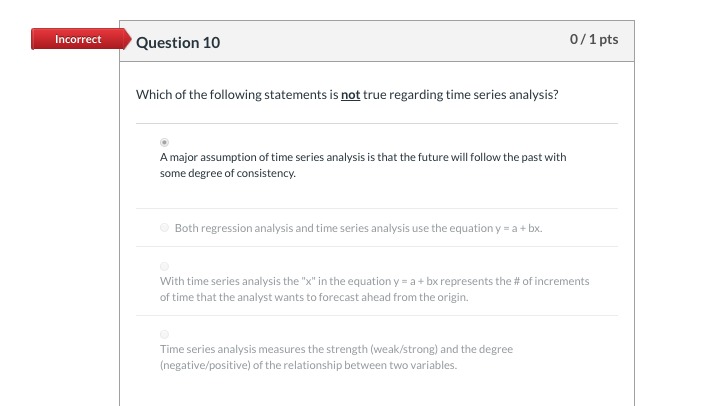
QUESTION 4 Forecasting using requires stable variables with no pronounced behavioral patterns. moving average O weighted moving average exponential smoothing regression analysis QUESTION 5 The mean absolute deviation (MAD) is: a short-term forecasting technique. a technique for measuring forecast errors. a technique for determining current demand. an input into time series analysis. QUESTION 6 can be used to indicate the need for a revision in the forecasting model, Tracking signals Demand behavior Seasonal adjustments All of the above.Consider the following time series data. (3} Construct a time series plot. What type of pattern exists in the data? (:3: The time series plot shows a seasonal pattern. (1': The time series plot shows a horizontal pattern. i\".- The time series plot shows a nonlinear trend. f"?- The time series plot shows a linear trend. (b) Use simple linear regression analysis to nd the parameters for the line that minimizes MSE for this time series. bu 2 b Ii 1 (c) What is the forecast for t = 6? Incorrect Question 10 0 / 1 pts Which of the following statements is not true regarding time series analysis? A major assumption of time series analysis is that the future will follow the past with some degree of consistency. Both regression analysis and time series analysis use the equationy = a + bx. With time series analysis the "x" in the equation y = a + bx represents the # of increments of time that the analyst wants to forecast ahead from the origin. O Time series analysis measures the strength (weak/strong) and the degree (negative/positive) of the relationship between two variables
Step by Step Solution
There are 3 Steps involved in it

Get step-by-step solutions from verified subject matter experts