

Question: The tables below present the results of a linear program to determine the optimal planting strategy for a farmer. He has 20 hectares and may
The tables below present the results of a linear program to determine the optimal planting strategy for a farmer. He has 20 hectares and may choose to plant any combination of corn, tomatoes, okra, and strawberries. The yield in bushels and revenue per ha for each crop is shown on the table below:
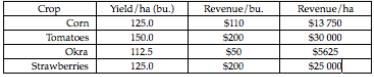
Crop Corn Tomatoes Okra Strawberries Yield/ha (bu.) 125.0 150.0 112.5 125.0 Revenue/bu. $110 $200 $50 $200 Revenue/ha $13750
The farmer must consider not only the profits available but also the resources available to him. He is limited not only by his hectarage, but also by the number of labor hours he has available to him for planting, tending, and harvesting, along with the amounts of fertilizer and water he can access.
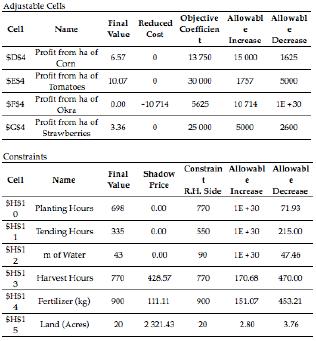
Adjustable Cells Cell Name Final Reduced Value Cost e Objective Allowabl Allowabl Coefficient Increase Decrease 13 750 15 00
a. What would be the impact on the profit if the objective function coefficient for Corn was to change to $27,500?
b. What would be the impact on the profit if the objective function coefficient for okra was to change to $14,000?
c. What would be the impact to the profit if we had to plant at least 4 ha in okra?
d. After the harvest is over, how many kg of fertilizer remain unused?
Crop Yield/ha (bu.) Revenue/bu. Revenue/ha Corn 125.0 $110 $13 750 Tomatoes 150.0 $200 S30 000 Okra 112.5 $50 $5625 Strawberries 125.0 $200 $25 000
Step by Step Solution
3.49 Rating (169 Votes )
There are 3 Steps involved in it
Solution Given sensitivity report is a What would be the impact to the profit if the objective funct... View full answer

Get step-by-step solutions from verified subject matter experts