

Question: The task is to write a code that produces this image which is aliased because the sampling frequency is lower than the aliasing frequency. import
The task is to write a code that produces this image which is aliased because the sampling frequency is lower than the aliasing frequency. import numpy as np import matplotlib.pyplot as plt k_spt_frq = 100 k_sampling = 720 x_matrix= np.tile(np.linspace(0,1,k_sampling),(240,1)) # 1 here reperesents the number of times you want to repeat the matrix y_matrix= (np.tile(np.linspace(0,1,k_sampling),(240,1))).T x = np.sin(2*np.pi*x_matrix*k_spt_frq) y = np.sin(2*np.pi*y_matrix*k_spt_frq) circle = np.abs(x**2+y**2) plt.imshow(circle,cmap ='gray')
This is what I have so far and i'm getiing some weird looking graph.
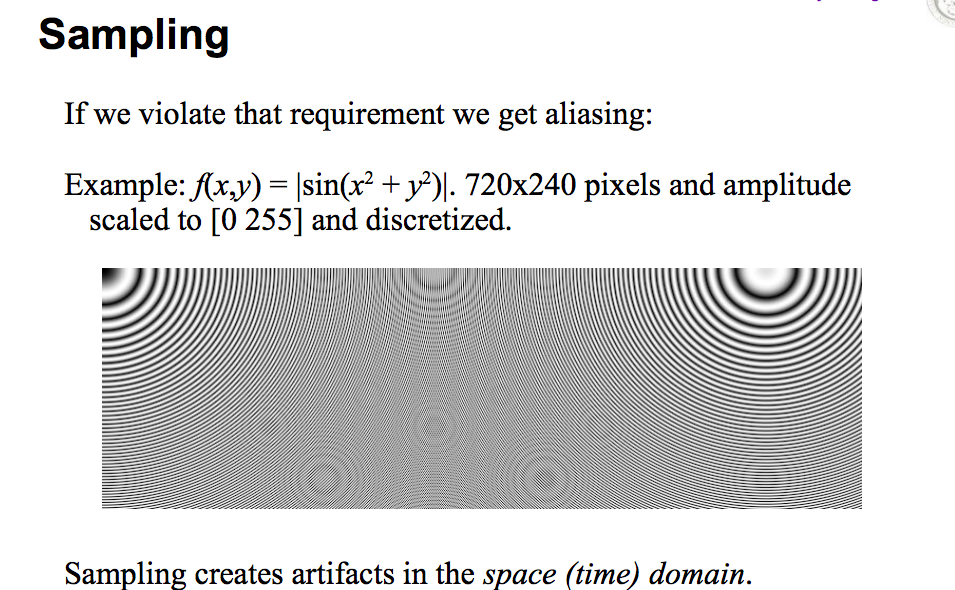
Sampling If we violate that requirement we get aliasing: Example: f(x,y) = (sin(x2 + y2)]. 720x240 pixels and amplitude scaled to [0 255] and discretized. Sampling creates artifacts in the space (time) domain. Sampling If we violate that requirement we get aliasing: Example: f(x,y) = (sin(x2 + y2)]. 720x240 pixels and amplitude scaled to [0 255] and discretized. Sampling creates artifacts in the space (time) domain
Step by Step Solution
There are 3 Steps involved in it

Get step-by-step solutions from verified subject matter experts