

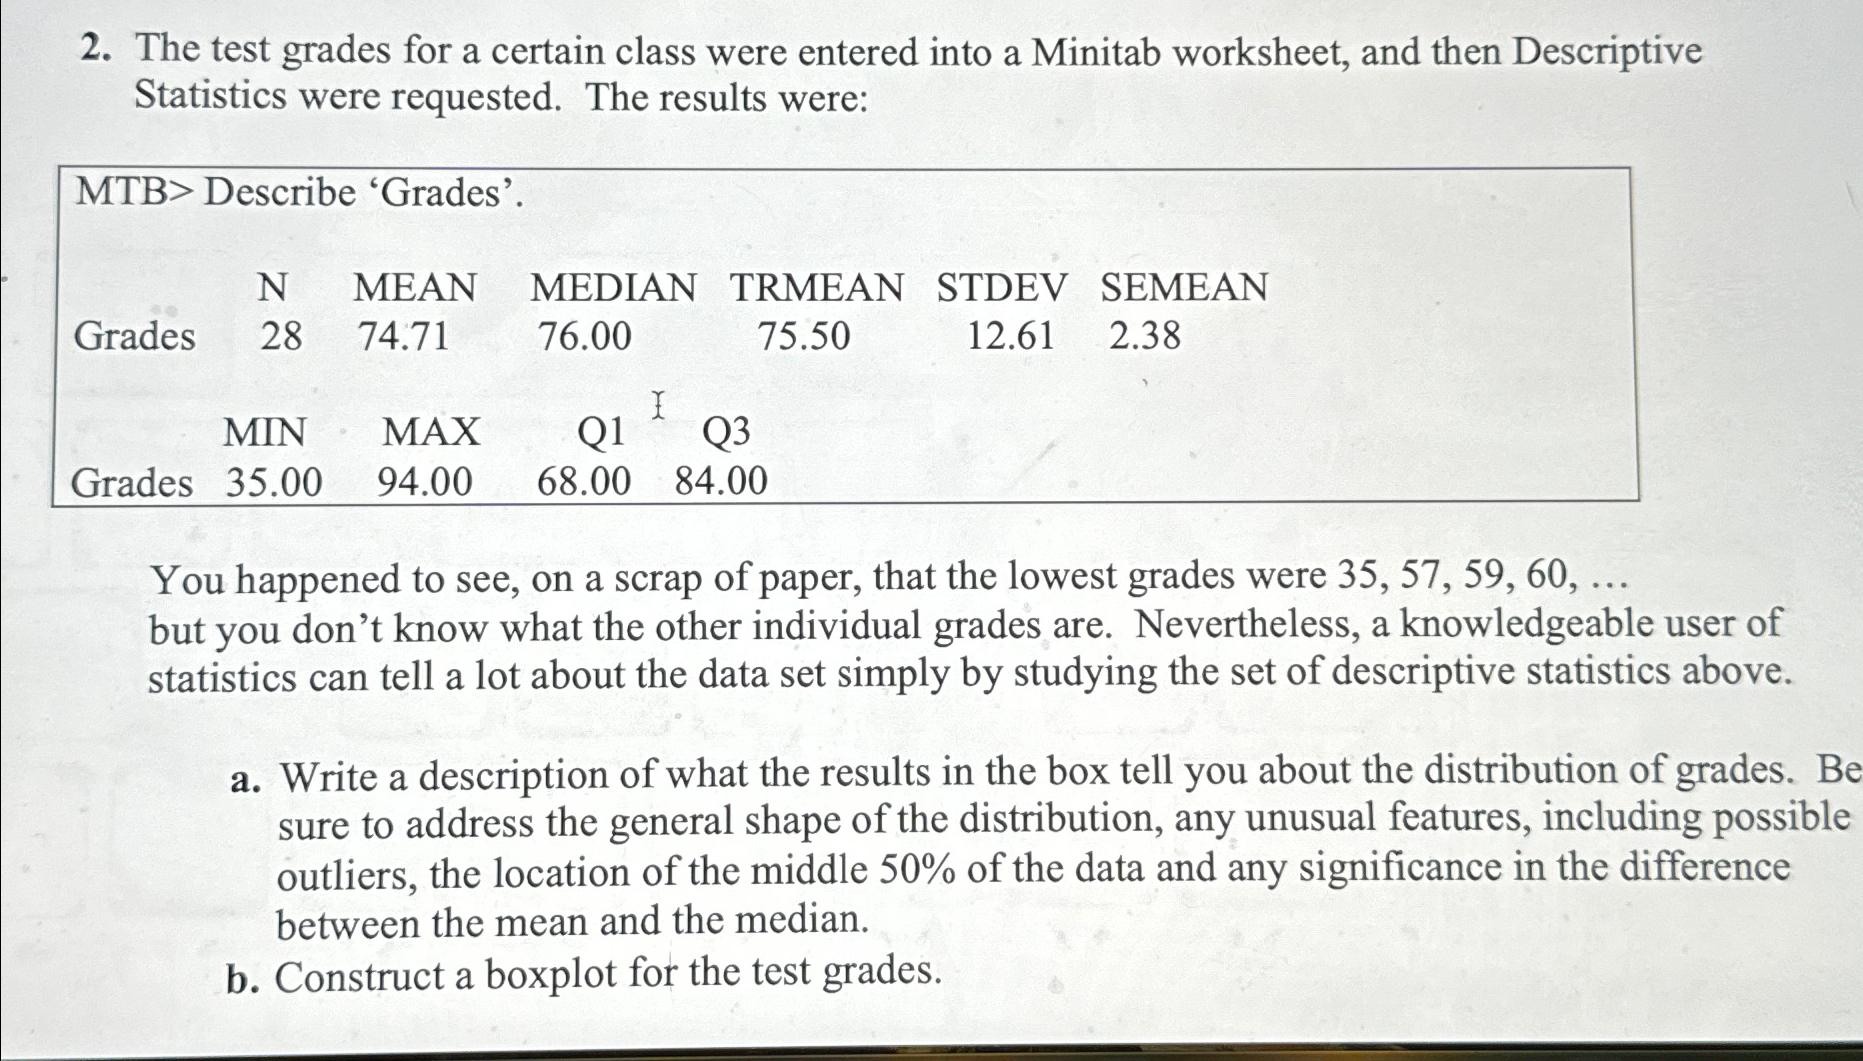
Question: The test grades for a certain class were entered into a Minitab worksheet, and then Descriptive Statistics were requested. The results were: MTB > Describe
The test grades for a certain class were entered into a Minitab worksheet, and then Descriptive Statistics were requested. The results were:
MTB Describe 'Grades
tableNMEAN,MEDIAN,TRMEAN,STDEV,SEMEANGradesMIN,MAX,QQGrades
You happened to see, on a scrap of paper, that the lowest grades were dots but you don't know what the other individual grades are. Nevertheless, a knowledgeable user of statistics can tell a lot about the data set simply by studying the set of descriptive statistics above.
a Write a description of what the results in the box tell you about the distribution of grades. Be sure to address the general shape of the distribution, any unusual features, including possible outliers, the location of the middle of the data and any significance in the difference between the mean and the median.
b Construct a boxplot for the test grades.
Step by Step Solution
There are 3 Steps involved in it
1 Expert Approved Answer
Step: 1 Unlock

Question Has Been Solved by an Expert!
Get step-by-step solutions from verified subject matter experts
Step: 2 Unlock
Step: 3 Unlock