

Question: The text notes that, for any linear demand curve, demand is price elastic in the upper half and price inelastic in the lower half.
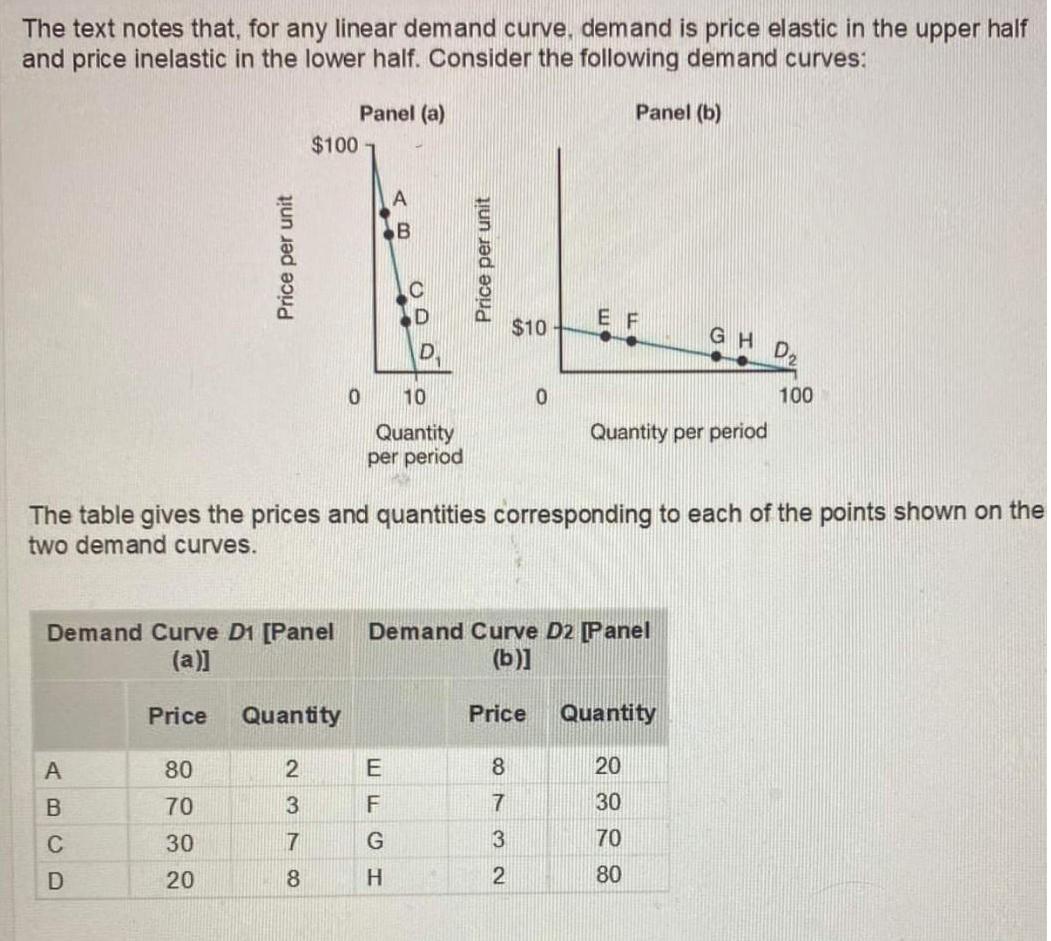
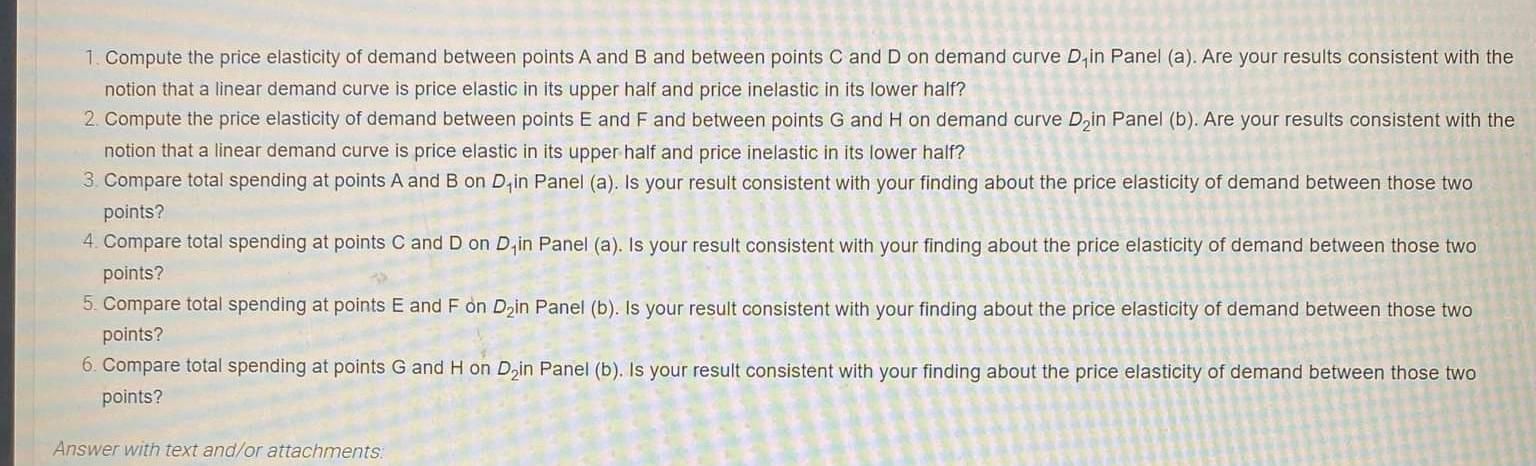
The text notes that, for any linear demand curve, demand is price elastic in the upper half and price inelastic in the lower half. Consider the following demand curves: Panel (a) Panel (b) Price per unit ABCD 80 70 30 20 $100 2 0 378 10 Quantity per period UD EE Price per unit Demand Curve D1 [Panel Demand Curve D2 [Panel (a)] (b)] Price Quantity F G H The table gives the prices and quantities corresponding to each of the points shown on the two demand curves. $10 0 Price 8732 EF Quantity per period Quantity 2828 20 30 GH D2 70 80 100 1. Compute the price elasticity of demand between points A and B and between points C and D on demand curve D,in Panel (a). Are your results consistent with the notion that a linear demand curve is price elastic in its upper half and price inelastic in its lower half? 2. Compute the price elasticity of demand between points E and F and between points G and H on demand curve Din Panel (b). Are your results consistent with the notion that a linear demand curve is price elastic in its upper half and price inelastic in its lower half? 3. Compare total spending at points A and B on D in Panel (a). Is your result consistent with your finding about the price elasticity of demand between those two points? 4. Compare total spending at points C and D on D in Panel (a). Is your result consistent with your finding about the price elasticity of demand between those two points? 5. Compare total spending at points E and F on Din Panel (b). Is your result consistent with your finding about the price elasticity of demand between those two points? 6. Compare total spending at points G and H on Din Panel (b). Is your result consistent with your finding about the price elasticity of demand between those two points? Answer with text and/or attachments:
Step by Step Solution
3.43 Rating (156 Votes )
There are 3 Steps involved in it

Get step-by-step solutions from verified subject matter experts