

Question: The time is 2 0 1 8 , and you just joined the FP&A team at Applied Materials. You are studying the financial statements of
The time is and you just joined the FP&A team at Applied Materials. You are studying the financial statements of the company and contemplating the companys recent announcement of META Center. Please answer the following questions using Applied Materials and Annual Reports, Srinivas guest lectures, and course materials that you see fit.
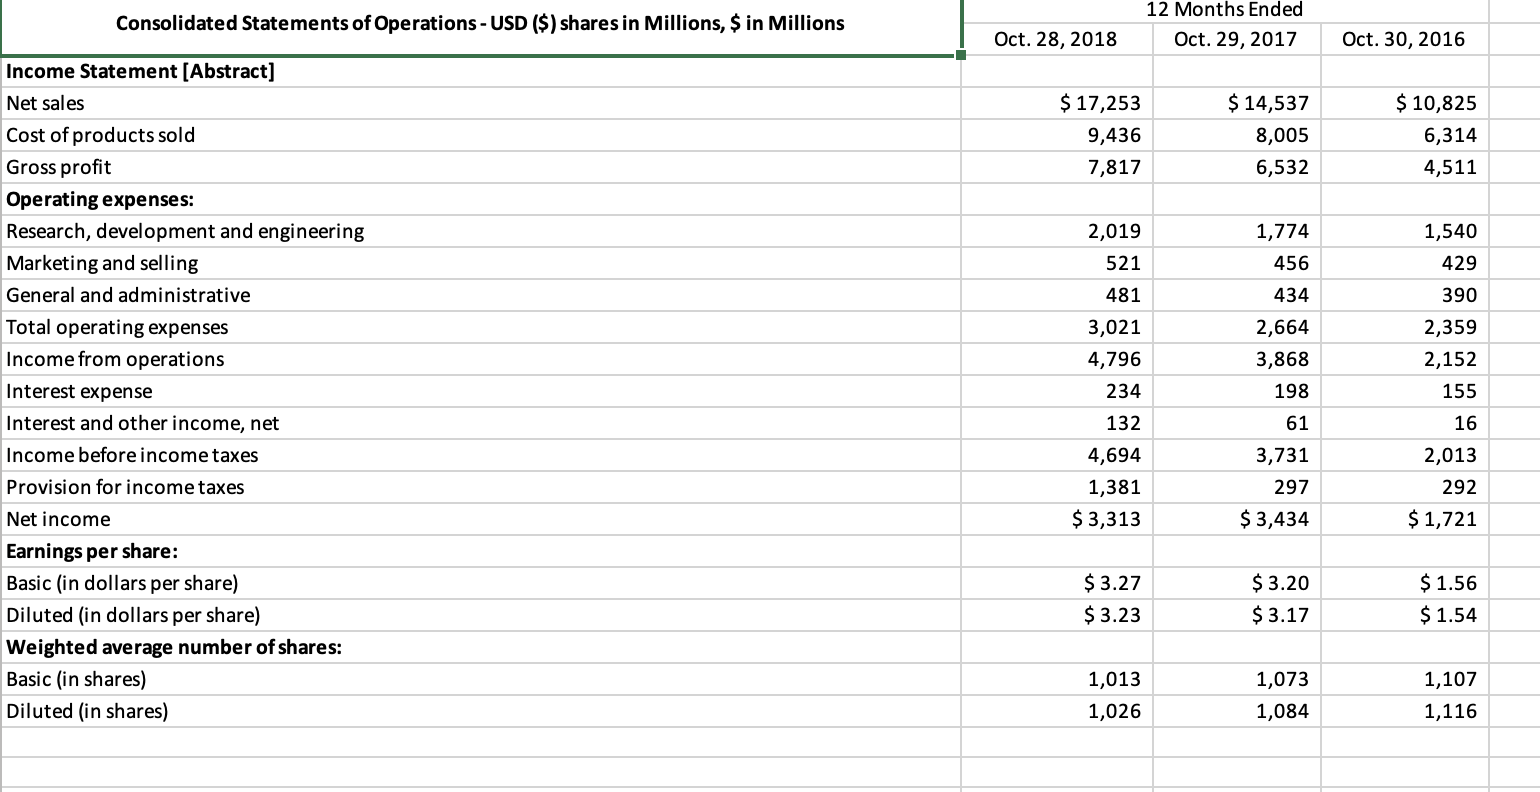
Compute the following financial ratios for and :
Liquidity ratios: Current ratio and Quick ratioSolvency ratios: Total debt ratio, Longterm debt ratio, Debtequity ratio, and Times interest earnedTurnover ratios: Inventory turnover, Receivable turnover, Fixed asset turnover, and Total asset turnoverProfitability ratio: Profit margin, ROA, ROEMarket value ratios: PE Markettobook, and Tobins Q
Given these ratios, what do you think of the financial health of the company? Are the changes in these ratios from to in the director you would like to see? Why or why not? Briefly explain.
Calculate free cash flows for and What do you think of the companys cash flow situation? Is the company financially constrained? Briefly discuss your results.
You want to understand how the entries on the financial statements are related to sales so that you can identify entries that are appropriate for the percentage of sales approach. As a starting point, you will work on the Consolidated Statements of Operations and Consolidated Balance Sheets and compute each entry as a percentage of sales for that year for the years of and Given your results, what entries are appropriate for the percentage of sales approach? Are your findings consistent with your understanding of the companys strategy?
In light of your analysis of the company as well as the discussion provided by our guest speaker, what do you think are the key drivers for the future performance of the META, drivers that the company should closely monitor and drive FP&As sensitivity analysis and scenario planning effort? Briefly explain. begintabularlllll
hline Consolidated Balance Sheets Parenthetical$ shares & Oct. & Oct. & Oct. &
hline Stockholders' equity: & & & &
hline Preferred stock, par value per share in dollars per share & $ & $ & $ &
hline Preferred stock, shares authorized & & & &
hline Preferred stock, shares issued & & & &
hline Common stock, par value per share in dollars per share & $ & $ & $ &
hline Common stock, shares authorized & & & &
hline Common stock, shares outstanding & & & &
hline Treasury stock, shares & & & &
hline & & & &
hline Common stock, share price at the end of fiscal year & $ & $ & $ &
hline
endtabular
Step by Step Solution
There are 3 Steps involved in it
1 Expert Approved Answer
Step: 1 Unlock

Question Has Been Solved by an Expert!
Get step-by-step solutions from verified subject matter experts
Step: 2 Unlock
Step: 3 Unlock