

Question: The Time Series graph below is a plot of stock prices from 2018 to 2022 created on STATA. 1/1/2018 Plot of stock prices 1/112020 Date

The Time Series graph below is a plot of stock prices from 2018 to 2022 created on STATA.
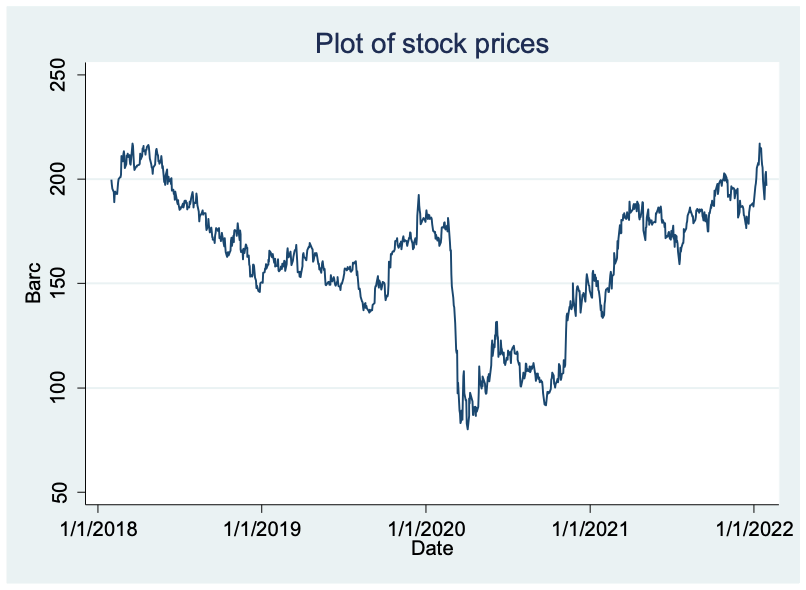
1/1/2018 Plot of stock prices 1/112020 Date 1/1/2021 1/112022
Step by Step Solution
There are 3 Steps involved in it
1 Expert Approved Answer
Step: 1 Unlock

Question Has Been Solved by an Expert!
Get step-by-step solutions from verified subject matter experts
Step: 2 Unlock
Step: 3 Unlock