

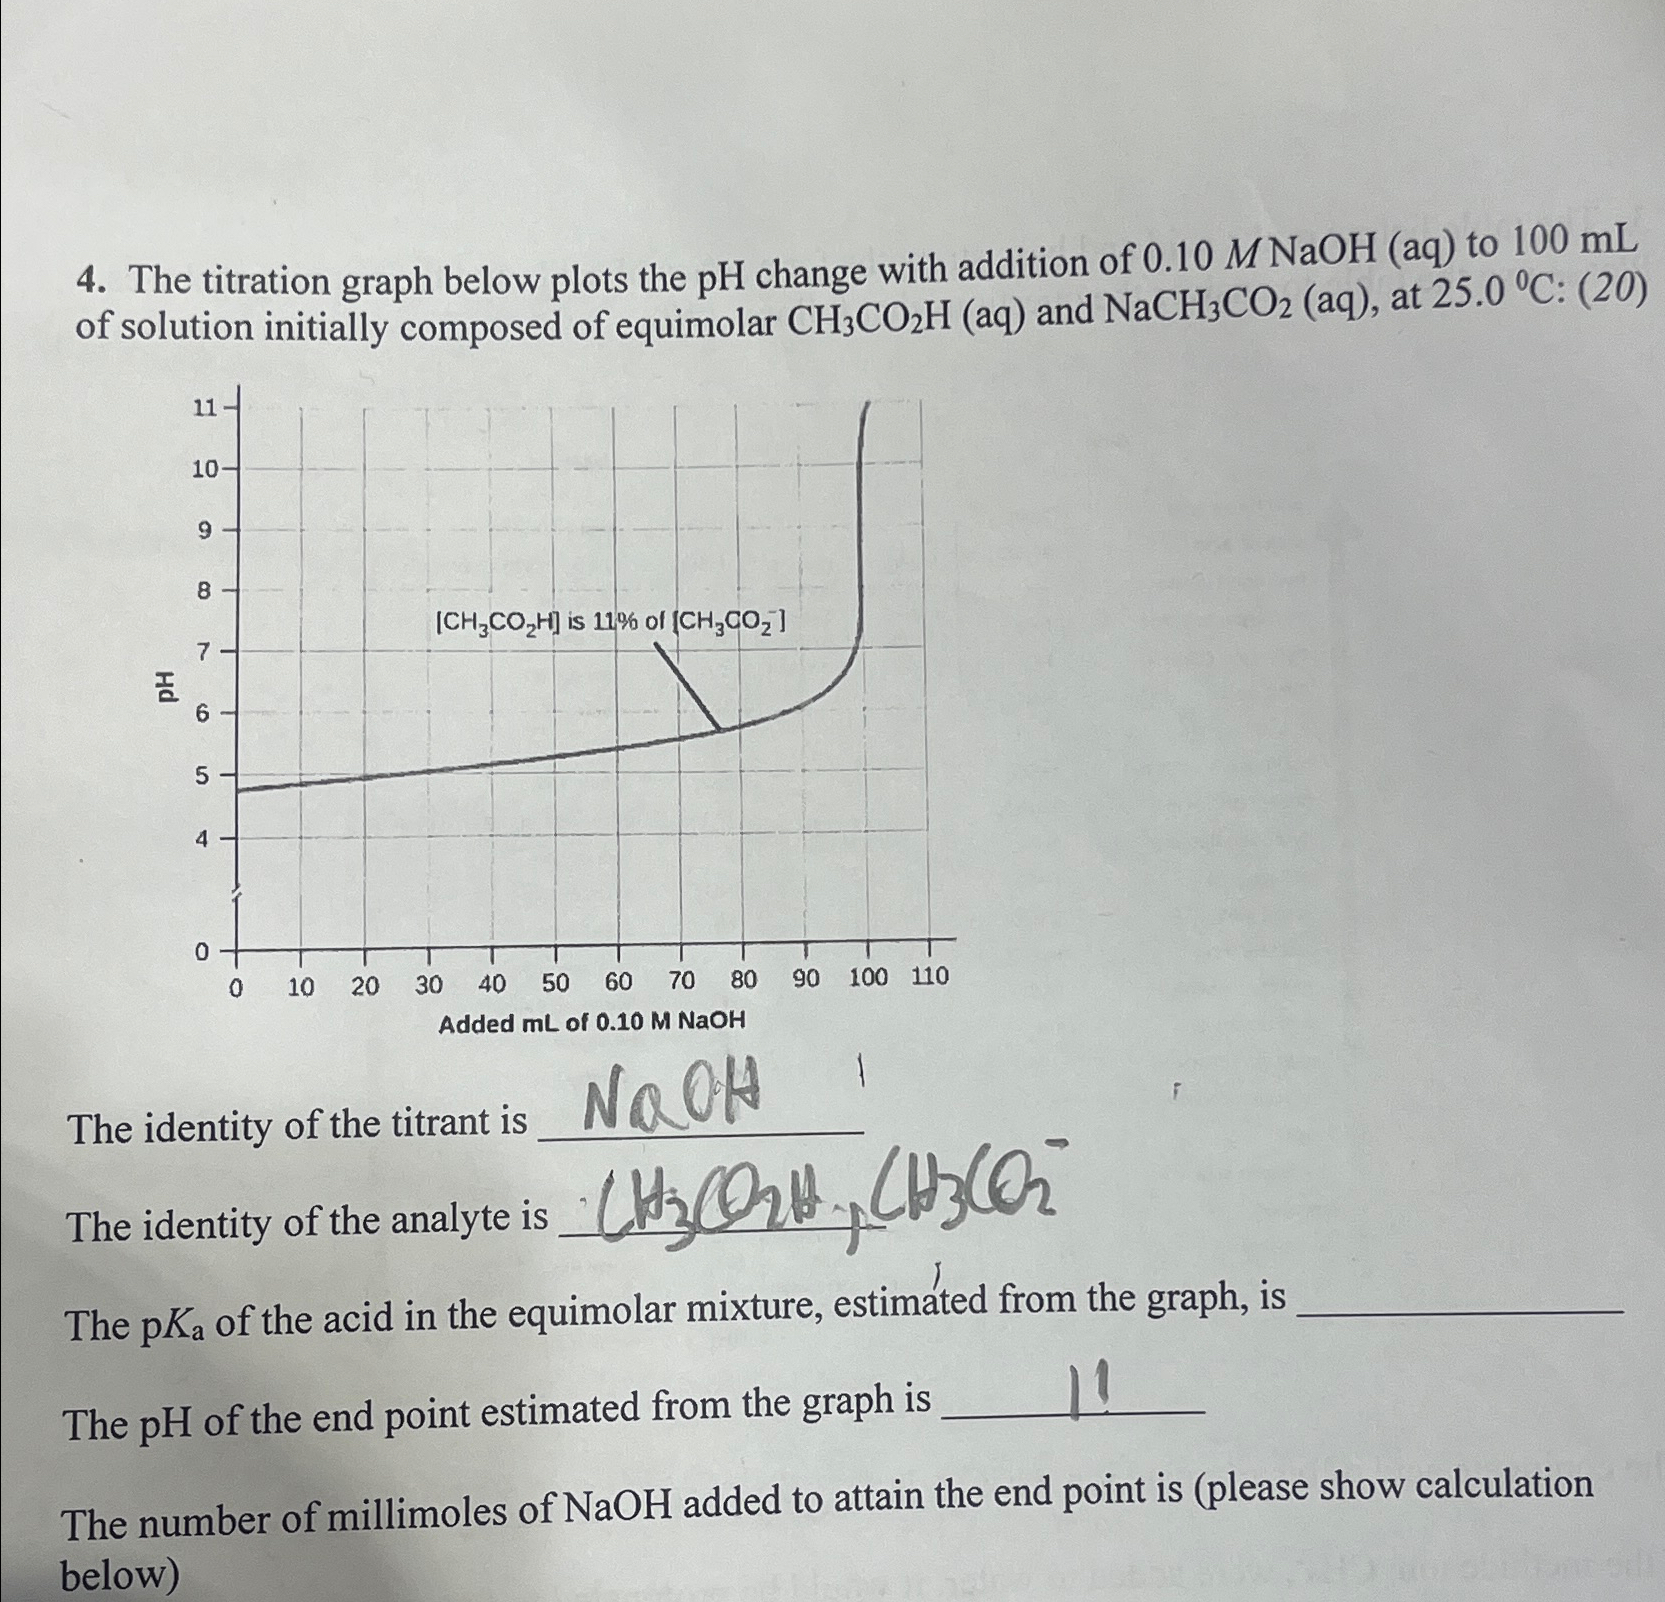
Question: The titration graph below plots the p H change with addition of 0 . 1 0 MNaOH ( a q ) to 1 0 0
The titration graph below plots the change with addition of MNaOH to of solution initially composed of equimolar and at :
The identity of the titrant is
The identity of the analyte is
The of the acid in the equimolar miTure estimated from the graph is
Step by Step Solution
There are 3 Steps involved in it
1 Expert Approved Answer
Step: 1 Unlock

Question Has Been Solved by an Expert!
Get step-by-step solutions from verified subject matter experts
Step: 2 Unlock
Step: 3 Unlock