

Question: The top portion is the assignment, the middle (excel) is what I have answered so far, there are a few I have not answered because
The top portion is the assignment, the middle (excel) is what I have answered so far, there are a few I have not answered because I don't know how to figure it out....the bottom image is the financial information that I have for this assignment thus far. Please help!
EYK 14-5. Accounting Research Problem: General Mills, Inc.
REQUIRED:
Using the fiscal year end 2019 annual report for General Mills, Inc. and the figures from the 2017 annual report as noted below, calculate the financial ratios for 2019 and 2018 indicated using the EXCEL template provided:
- Gross profit percentage
- Return on sales
- Asset turnover
- Return on assets
- Return on common stockholders equity
- Current ratio
- Quick ratio
- Operating-cash-flow-to-current-liabilities ratio
- Accounts receivable turnover
- Average collection period
- Inventory turnover
- Days sales in inventory
- Debt-to-equity ratio
- Times-interest-earned ratio
- Operating-cash-flow-to-capital-expenditures ratio
- Earnings per share
- Price-earnings ratio
- Dividend yield
- Dividend payout ratio
Total assets 2017 = $21,812.6
Total stockholders equity 2017 = $4,327.9
Total current liabilities 2017 = $5,330.8
Accounts receivable 2017 = $1,430.1
Inventory 2017 = $1,483.6
Year-end closing stock price May 2019 = $50.93
Year-end closing stock price May 2018 = $39.37
Perform a comparative analysis of the data between the two years. Comment briefly on the changes from fiscal 2018 to 2019. Identify trends and explain the implications of each trend.
eral Mills, Inc. is available on this books web site.
Required
a. Calculate (or identify) the following financial ratios for 2016 and 2017:
1. Gross profit percentage
2. Return on sales
3. Asset turnover (2015, total assets 5 $21,832.0 million)
4. Return on assets (2015, total assets 5 $21,832.0 million)
5. Return on common stockholders equity (2015, total stockholders equity 5
$4,996.7 million)
6. Current ratio
7. Quick ratio
8. Operating-cash-flow-to-current-liabilities ratio (2015, current liabilities 5 $4,890.1
million)
9. Accounts receivable turnover (2015, accounts receivable 5 $1,386.7 million)
10. Average collection period
11. Inventory turnover (2015, inventory 5 $1,540.9 million)
12. Days sales in inventory
13. Debt-to-equity ratio
14. Times-interest-earned ratio
15. Operating-cash-flow-to-capital-expenditures ratio
16. Earnings per share
17. Price-earnings ratio (Use year-end adjusted closing stock price of $57.32 for 2017 and
$63.69 for 2016.)
18. Dividend yield
19. Dividend payout ratio
b. Comment briefly on the changes from fiscal 2016 to fiscal 2017 in the ratios computed above.
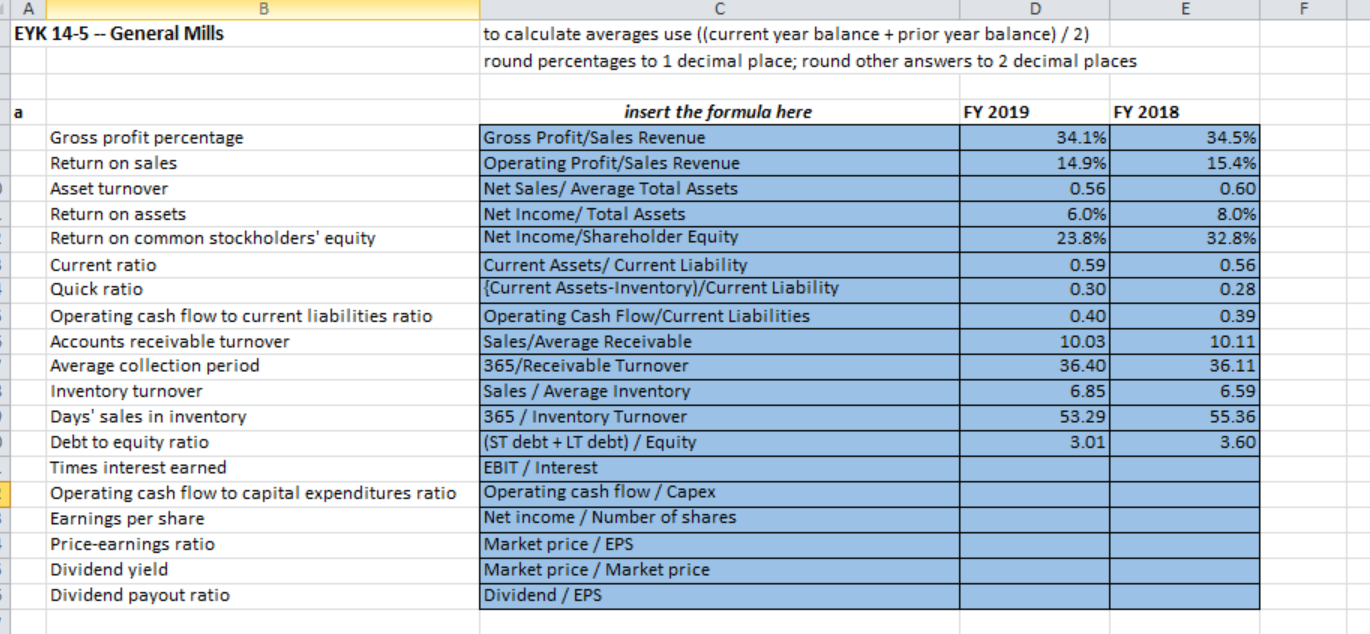
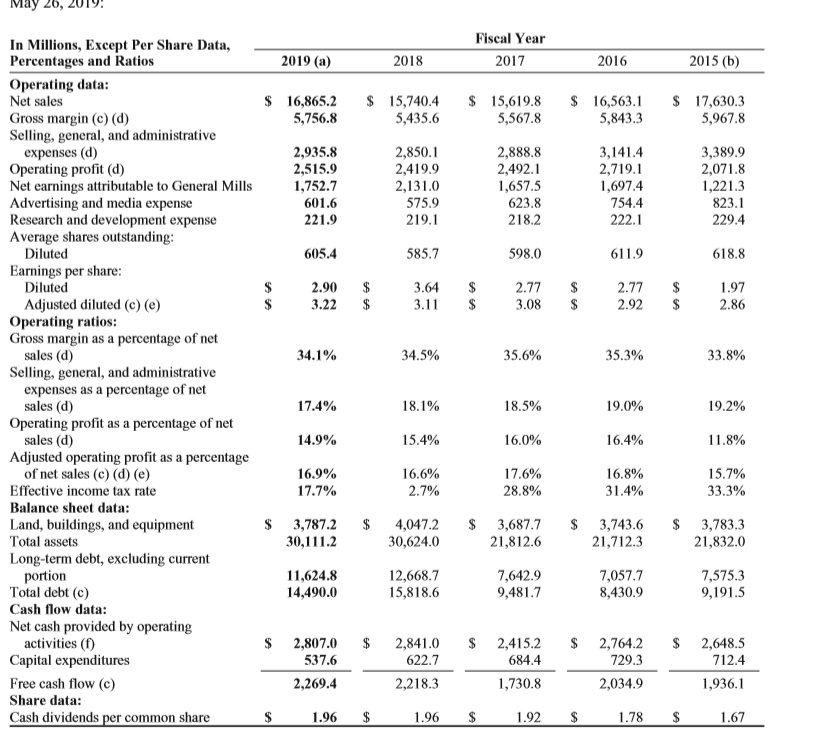
B E F EYK 14-5--General Mills D to calculate averages use ((current year balance + prior year balance) / 2) round percentages to 1 decimal place; round other answers to 2 decimal places FY 2019 Gross profit percentage Return on sales Asset turnover Return on assets Return on common stockholders' equity Current ratio Quick ratio Operating cash flow to current liabilities ratio Accounts receivable turnover Average collection period Inventory turnover Days' sales in inventory Debt to equity ratio Times interest earned Operating cash flow to capital expenditures ratio Earnings per share Price-earnings ratio Dividend yield Dividend payout ratio insert the formula here Gross Profit/Sales Revenue Operating Profit/Sales Revenue Net Sales/ Average Total Assets Net Income/ Total Assets Net Income/Shareholder Equity Current Assets/ Current Liability Current Assets-Inventory)/Current Liability Operating Cash Flow/Current Liabilities Sales/Average Receivable 365/Receivable Turnover Sales / Average Inventory 365 / Inventory Turnover (ST debt + LT debt) / Equity EBIT/ Interest Operating cash flow / Capex Net income / Number of shares Market price / EPS Market price / Market price Dividend / EPS FY 2018 34.1% 14.9% 0.56 6.0% 23.8% 0.59 0.30 0.40 10.03 36.40 6.85 53.29 3.01 34.5%) 15.4% 0.60 8.0% 32.8% 0.56 0.28 0.391 10.11 36.11 6.59 55.36 3.60 May 20, Fiscal Year 2017 2019 (a) 2018 2016 2015 (6) $ 16,865.2 5,756.8 $ 15,740.4 5,435.6 $ 15,619.8 5,567.8 $ 16,563.1 5,843.3 $ 17,630.3 5,967.8 2,935.8 2,515.9 1,752.7 601.6 221.9 2,850.1 2,419.9 2,131.0 575.9 219.1 2,888.8 2,492.1 1,657.5 623.8 218.2 3,141.4 2,719.1 1,697.4 754.4 222.1 3,389.9 2,071.8 1,221.3 823.1 229.4 605.4 585.7 598.0 611.9 618.8 2.77 $ $ 2.90 3.22 $ $ 3.64 3.11 $ $ 2.77 3.08 $ $ $ $ 1.97 2.86 2.92 34.1% 34.5% 35.6% 35.3% 33.8% In Millions, Except Per Share Data, Percentages and Ratios Operating data: Net sales Gross margin (c) (d) Selling, general, and administrative expenses (d) Operating profit (d) Net earnings attributable to General Mills Advertising and media expense Research and development expense Average shares outstanding: Diluted Earnings per share: Diluted Adjusted diluted (e) (e) Operating ratios: Gross margin as a percentage of net sales (d) Selling, general, and administrative expenses as a percentage of net sales (d) Operating profit as a percentage of net sales (d) Adjusted operating profit as a percentage of net sales (c) (d) (e) Effective income tax rate Balance sheet data: Land, buildings, and equipment Total assets Long-term debt, excluding current portion Total debt (c) Cash flow data: Net cash provided by operating activities (1) Capital expenditures Free cash flow (C) Share data: Cash dividends per common share 17.4% 18.1% 18.5% 19.0% 19.2% 14.9% 15.4% 16.0% 16.4% 11.8% 16.9% 17.7% 16.6% 2.7% 17.6% 28.8% 16.8% 31.4% 15.7% 33.3% $ $ 3,787.2 30,111.2 4,047.2 30,624.0 $ 3,687.7 21,812.6 $ 3,743.6 21,712.3 $ 3,783.3 21,832.0 11,624.8 14,490.0 12,668.7 15,818.6 7,642.9 9,481.7 7,057.7 8,430.9 7,575.3 9,191.5 $ $ $ 2,807.0 537.6 2,269.4 2,841.0 622.7 2,218.3 2,415.2 684.4 1,730.8 $ 2,764.2 729.3 2,034.9 $ 2,648.5 712.4 1,936.1 $ 1.96 $ 1.96 $ 1.92 $ 1.78 $ 1.67 B E F EYK 14-5--General Mills D to calculate averages use ((current year balance + prior year balance) / 2) round percentages to 1 decimal place; round other answers to 2 decimal places FY 2019 Gross profit percentage Return on sales Asset turnover Return on assets Return on common stockholders' equity Current ratio Quick ratio Operating cash flow to current liabilities ratio Accounts receivable turnover Average collection period Inventory turnover Days' sales in inventory Debt to equity ratio Times interest earned Operating cash flow to capital expenditures ratio Earnings per share Price-earnings ratio Dividend yield Dividend payout ratio insert the formula here Gross Profit/Sales Revenue Operating Profit/Sales Revenue Net Sales/ Average Total Assets Net Income/ Total Assets Net Income/Shareholder Equity Current Assets/ Current Liability Current Assets-Inventory)/Current Liability Operating Cash Flow/Current Liabilities Sales/Average Receivable 365/Receivable Turnover Sales / Average Inventory 365 / Inventory Turnover (ST debt + LT debt) / Equity EBIT/ Interest Operating cash flow / Capex Net income / Number of shares Market price / EPS Market price / Market price Dividend / EPS FY 2018 34.1% 14.9% 0.56 6.0% 23.8% 0.59 0.30 0.40 10.03 36.40 6.85 53.29 3.01 34.5%) 15.4% 0.60 8.0% 32.8% 0.56 0.28 0.391 10.11 36.11 6.59 55.36 3.60 May 20, Fiscal Year 2017 2019 (a) 2018 2016 2015 (6) $ 16,865.2 5,756.8 $ 15,740.4 5,435.6 $ 15,619.8 5,567.8 $ 16,563.1 5,843.3 $ 17,630.3 5,967.8 2,935.8 2,515.9 1,752.7 601.6 221.9 2,850.1 2,419.9 2,131.0 575.9 219.1 2,888.8 2,492.1 1,657.5 623.8 218.2 3,141.4 2,719.1 1,697.4 754.4 222.1 3,389.9 2,071.8 1,221.3 823.1 229.4 605.4 585.7 598.0 611.9 618.8 2.77 $ $ 2.90 3.22 $ $ 3.64 3.11 $ $ 2.77 3.08 $ $ $ $ 1.97 2.86 2.92 34.1% 34.5% 35.6% 35.3% 33.8% In Millions, Except Per Share Data, Percentages and Ratios Operating data: Net sales Gross margin (c) (d) Selling, general, and administrative expenses (d) Operating profit (d) Net earnings attributable to General Mills Advertising and media expense Research and development expense Average shares outstanding: Diluted Earnings per share: Diluted Adjusted diluted (e) (e) Operating ratios: Gross margin as a percentage of net sales (d) Selling, general, and administrative expenses as a percentage of net sales (d) Operating profit as a percentage of net sales (d) Adjusted operating profit as a percentage of net sales (c) (d) (e) Effective income tax rate Balance sheet data: Land, buildings, and equipment Total assets Long-term debt, excluding current portion Total debt (c) Cash flow data: Net cash provided by operating activities (1) Capital expenditures Free cash flow (C) Share data: Cash dividends per common share 17.4% 18.1% 18.5% 19.0% 19.2% 14.9% 15.4% 16.0% 16.4% 11.8% 16.9% 17.7% 16.6% 2.7% 17.6% 28.8% 16.8% 31.4% 15.7% 33.3% $ $ 3,787.2 30,111.2 4,047.2 30,624.0 $ 3,687.7 21,812.6 $ 3,743.6 21,712.3 $ 3,783.3 21,832.0 11,624.8 14,490.0 12,668.7 15,818.6 7,642.9 9,481.7 7,057.7 8,430.9 7,575.3 9,191.5 $ $ $ 2,807.0 537.6 2,269.4 2,841.0 622.7 2,218.3 2,415.2 684.4 1,730.8 $ 2,764.2 729.3 2,034.9 $ 2,648.5 712.4 1,936.1 $ 1.96 $ 1.96 $ 1.92 $ 1.78 $ 1.67
Step by Step Solution
There are 3 Steps involved in it

Get step-by-step solutions from verified subject matter experts