

Question: The top two (2) potential problems management should focus on, supported both quantitatively and qualitatively . What is the consequence of each of these problems
- The top two (2) potential problems management should focus on, supported both quantitatively and qualitatively. What is the consequence of each of these problems if they are not solved?
- Utilizing creativity and critical thinking, discuss three (3) potential causes for each of the problems stated above.
- Utilizing creativity and critical thinking, discuss a potential solution for each of the above-mentioned causes. As in class, you can scaffold and layer each solution. Showcase an understanding of the various stakeholders that could be impacted either negatively or positively by your solution.
- Were there other accounts that had unfavourable changes, but were not identified as the top two? Support numerically.
- What did management do well? What accounts had favourable changes? Support numerically
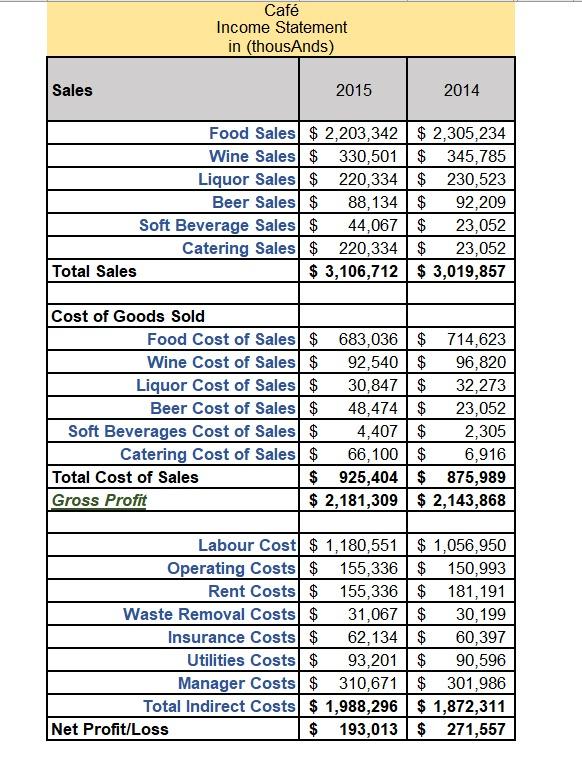
Caf Income Statement in (thousAnds) Sales 2015 2014 Food Sales $ 2,203,342 $ 2,305,234 Wine Sales $ 330,501 $ 345,785 Liquor Sales $ 220,334 $ 230,523 Beer Sales $ 88,134 $ 92,209 Soft Beverage Sales $ 44,067 $ 23,052 Catering Sales $ 220,334 $ 23,052 Total Sales $ 3,106,712 $ 3,019,857 Cost of Goods Sold Food Cost of Sales $ 683,036 $ 714,623 Wine Cost of Sales $ 92,540 $ 96,820 Liquor Cost of Sales $ 30,847 $ 32,273 Beer Cost of Sales $ 48,474 $ 23,052 Soft Beverages Cost of Sales $ 4,407 $ 2,305 Catering Cost of Sales $ 66,100 $ 6,916 Total Cost of Sales $ 925,404 $ 875,989 Gross Profit $ 2,181,309 $ 2,143,868 Labour Cost $ 1,180,551 $ 1,056,950 Operating costs $ 155,336 $ 150,993 Rent Costs $ 155,336 $ 181,191 Waste Removal Costs $ 31,067 $ 30,199 Insurance Costs $ 62,134 $ 60,397 Utilities Costs $ 93,201$ 90,596 Manager Costs $ 310,671 $ 301,986 Total Indirect Costs $ 1,988,296 $ 1,872,311 Net Profit/Loss $ 193,013 $ 271,557 Caf Income Statement in (thousAnds) Sales 2015 2014 Food Sales $ 2,203,342 $ 2,305,234 Wine Sales $ 330,501 $ 345,785 Liquor Sales $ 220,334 $ 230,523 Beer Sales $ 88,134 $ 92,209 Soft Beverage Sales $ 44,067 $ 23,052 Catering Sales $ 220,334 $ 23,052 Total Sales $ 3,106,712 $ 3,019,857 Cost of Goods Sold Food Cost of Sales $ 683,036 $ 714,623 Wine Cost of Sales $ 92,540 $ 96,820 Liquor Cost of Sales $ 30,847 $ 32,273 Beer Cost of Sales $ 48,474 $ 23,052 Soft Beverages Cost of Sales $ 4,407 $ 2,305 Catering Cost of Sales $ 66,100 $ 6,916 Total Cost of Sales $ 925,404 $ 875,989 Gross Profit $ 2,181,309 $ 2,143,868 Labour Cost $ 1,180,551 $ 1,056,950 Operating costs $ 155,336 $ 150,993 Rent Costs $ 155,336 $ 181,191 Waste Removal Costs $ 31,067 $ 30,199 Insurance Costs $ 62,134 $ 60,397 Utilities Costs $ 93,201$ 90,596 Manager Costs $ 310,671 $ 301,986 Total Indirect Costs $ 1,988,296 $ 1,872,311 Net Profit/Loss $ 193,013 $ 271,557
Step by Step Solution
There are 3 Steps involved in it

Get step-by-step solutions from verified subject matter experts