

Question: The total calls reduced in operational 2 workgroup. In total 2020 and 2021 calls were down by 10% compared to each of their previous years.
The total calls reduced in operational 2 workgroup. In total 2020 and 2021 calls were down by 10% compared to each of their previous years.
Despite all these factors cost of calls for service has continued to increase.
Explain why CFS costs increased by nearly 3% in 2023 Annual Billing Statement?
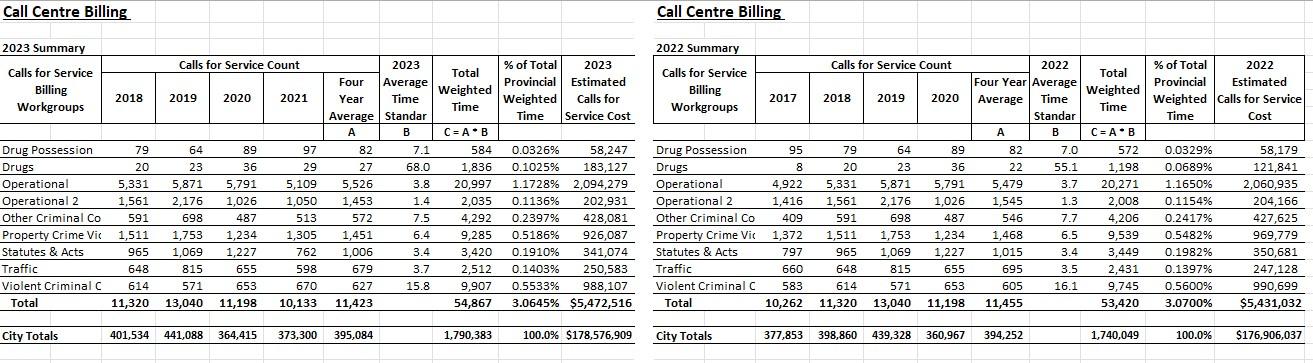
Call Centre Billing 2023 Summary Calls for Service Billing Workgroups Drug Possession Drugs Operational Operational 2 Other Criminal Co Property Crime Vic Statutes & Acts Traffic Violent Criminal C Total City Totals 2018 79 20 5,331 1,561 591 1,511 965 648 614 11,320 Calls for Service Count 2019 2020 2021 64 89 36 23 5,871 5,791 2,176 1,026 698 487 1,753 1,234 1,069 1,227 815 655 571 653 13,040 11,198 10,133 97 29 5,109 1,050 513 1,305 762 598 670 Four Year Average A 82 27 5,526 1,453 572 1,451 1,006 679 627 11,423 401,534 441,088 364,415 373,300 395,084 2023 Average Time Standar B 7.1 68.0 3.8 1.4 7.5 6.4 3.4 3.7 15.8 Total Weighted Time % of Total Provincial Weighted 1,790,383 2023 Estimated Calls for Time Service Cost C = A B 584 0.0326% 58,247 1,836 0.1025% 183,127 20,997 1.1728 % 2,094,279 2,035 0.1136% 202,931 4,292 0.2397% 428,081 9.285 0.5186% 926,087 3,420 0.1910% 341,074 2,512 0.1403% 250,583 9,907 0.5533% 988,107 54,867 3.0645% $5,472,516 100.0% $178.576,909 Call Centre Billing 2022 Summary Calls for Service Billing Workgroups Drug Possession. Drugs Operational Operational 2 Other Criminal Co Property Crime Vic Statutes & Acts Traffic Violent Criminal C Total City Totals 2017 Calls for Service Count 2018 2019 2020 95 79 64 89 8 20 23 36 4,922 5,331 5,871 5,791 1,416 1,561 2,176 1,026 409 591 698 487 1,372 1,511 1,753 1,234 797 965 1,069 1,227 660 648 815 655 583 614 571 653 10,262 11,320 13,040 11,198 377,853 398,860 439,328 360,967 2022 Total Four Year Average Weighted Average Time Time Standar B C=A B 7.0 572 0.0329% 55.1 1,198 0.0689% 3.7 20,271 1.1650% 1.3 2,008 0.1154% 7.7 4,206 0.2417% 6.5 9,539 0.5482% 3.4 3,449 0.1982% 3.5 2,431 0.1397% 16.1 9,745 0.5600% 53,420 3.0700% A 82 22 5,479 1,545 546 1,468 1,015 695 605 11,455 394,252 % of Total 2022 Provincial Estimated Weighted Calls for Service Time Cost 1,740,049 58,179 121,841 2,060,935 204,166 427,625 969,779 350,681 247,128 990,699 $5,431,032 100.0% $176,906,037
Step by Step Solution
3.47 Rating (154 Votes )
There are 3 Steps involved in it
To understand why the cost of calls for service CFS increased by nearly 3 in the 2023 Annual Billing Statement lets analyze the provided data In the table there are various workgroups listed such as A ... View full answer

Get step-by-step solutions from verified subject matter experts