

Question: The tracking signals computed using past demand history for three different products are as follows. Each product used the same forecasting technique. TS 1 TS
The tracking signals computed using past demand history for three different products are as follows. Each product used the same forecasting technique.
| TS 1 | TS 2 | TS 3 | |
| 1 | 2.23 | 1.57 | 0.18 |
| 2 | 1.53 | −0.64 | 0.44 |
| 3 | 0.43 | 2.09 | 1.04 |
| 4 | 0.13 | 2.64 | 1.88 |
| 5 | −0.97 | −0.90 | 1.95 |
| 6 | −0.75 | −1.26 | 2.26 |
| 7 | −1.22 | 0.80 | 3.12 |
| 8 | −1.33 | −1.59 | 3.01 |
| 9 | −1.99 | 0.44 | 3.52 |
| 10 | −2.41 | 2.73 | 3.76 |
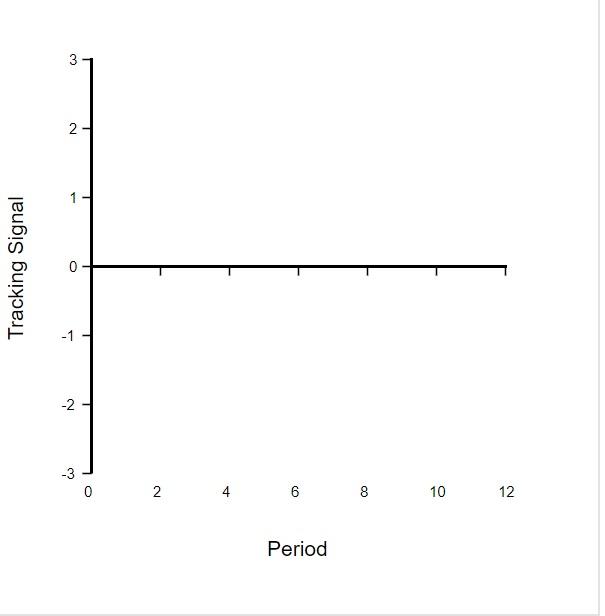
a. Graph the tracking signals for each product.
Instructions:
1. Use the line tool to draw the tracking signals (TS1, TS2, TS3) for each product.
2. To earn full credit for this graph you must plot all required points, beginning with the first unit.
b. Comment on the above.
| Forecast | |
| TS 1 | Poor/Acceptable |
| TS 2 | Poor/Acceptable |
| TS 3 | Poor/Acceptable |
Tracking Signal 3 2- -2 -3 0 2 4 6 Period 8 10 12
Step by Step Solution
3.47 Rating (154 Votes )
There are 3 Steps involved in it
Answer Solution i a Tracking Signals graph is following b iWe ... View full answer

Get step-by-step solutions from verified subject matter experts