

Question: The two columns (variables) in df2. csv contain the following information for 38 patients: Cholesterol: Cholesterol in mg/dl HeartDisease: Heart disease diagnosis (No or Yes)
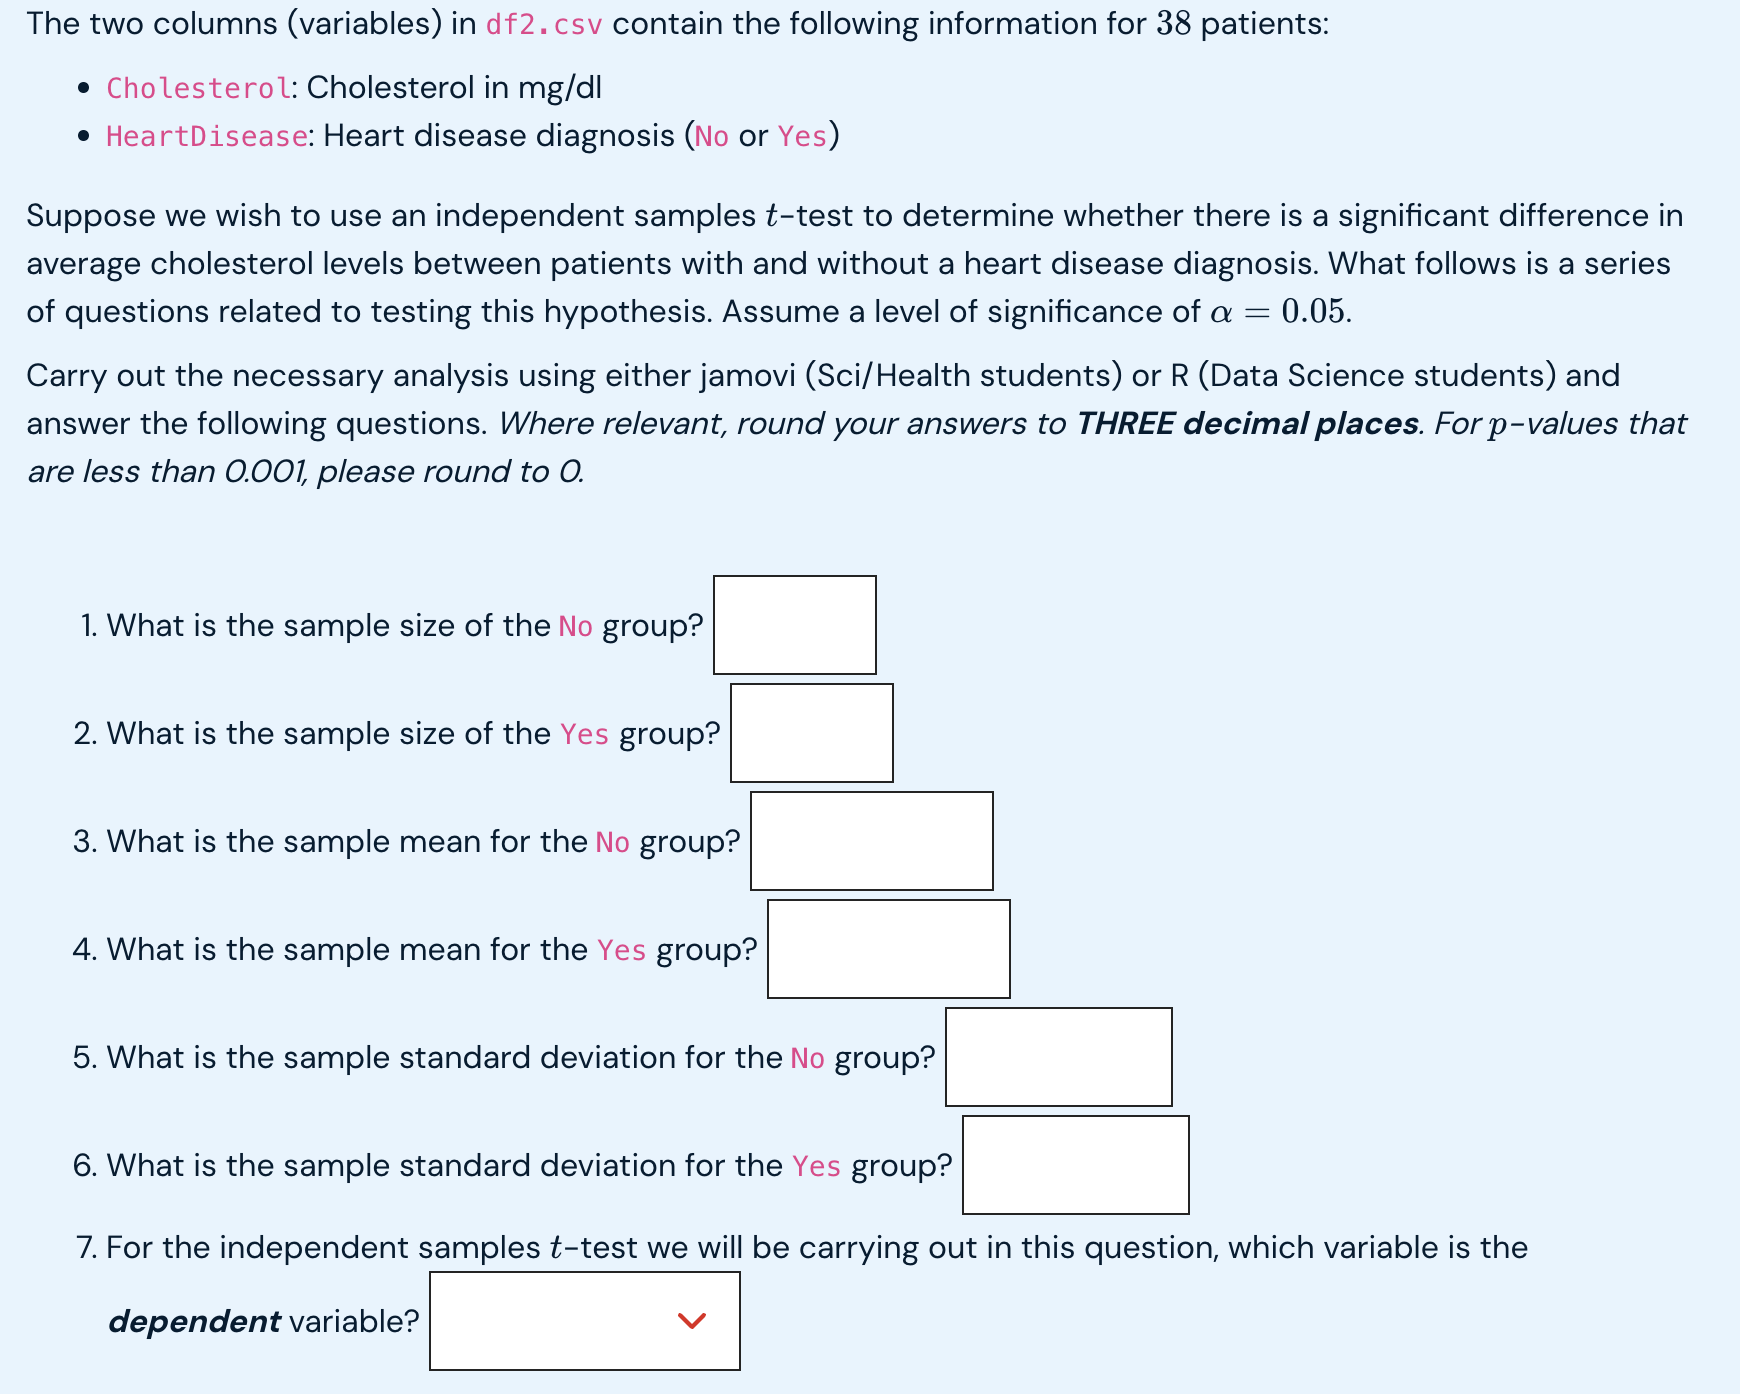
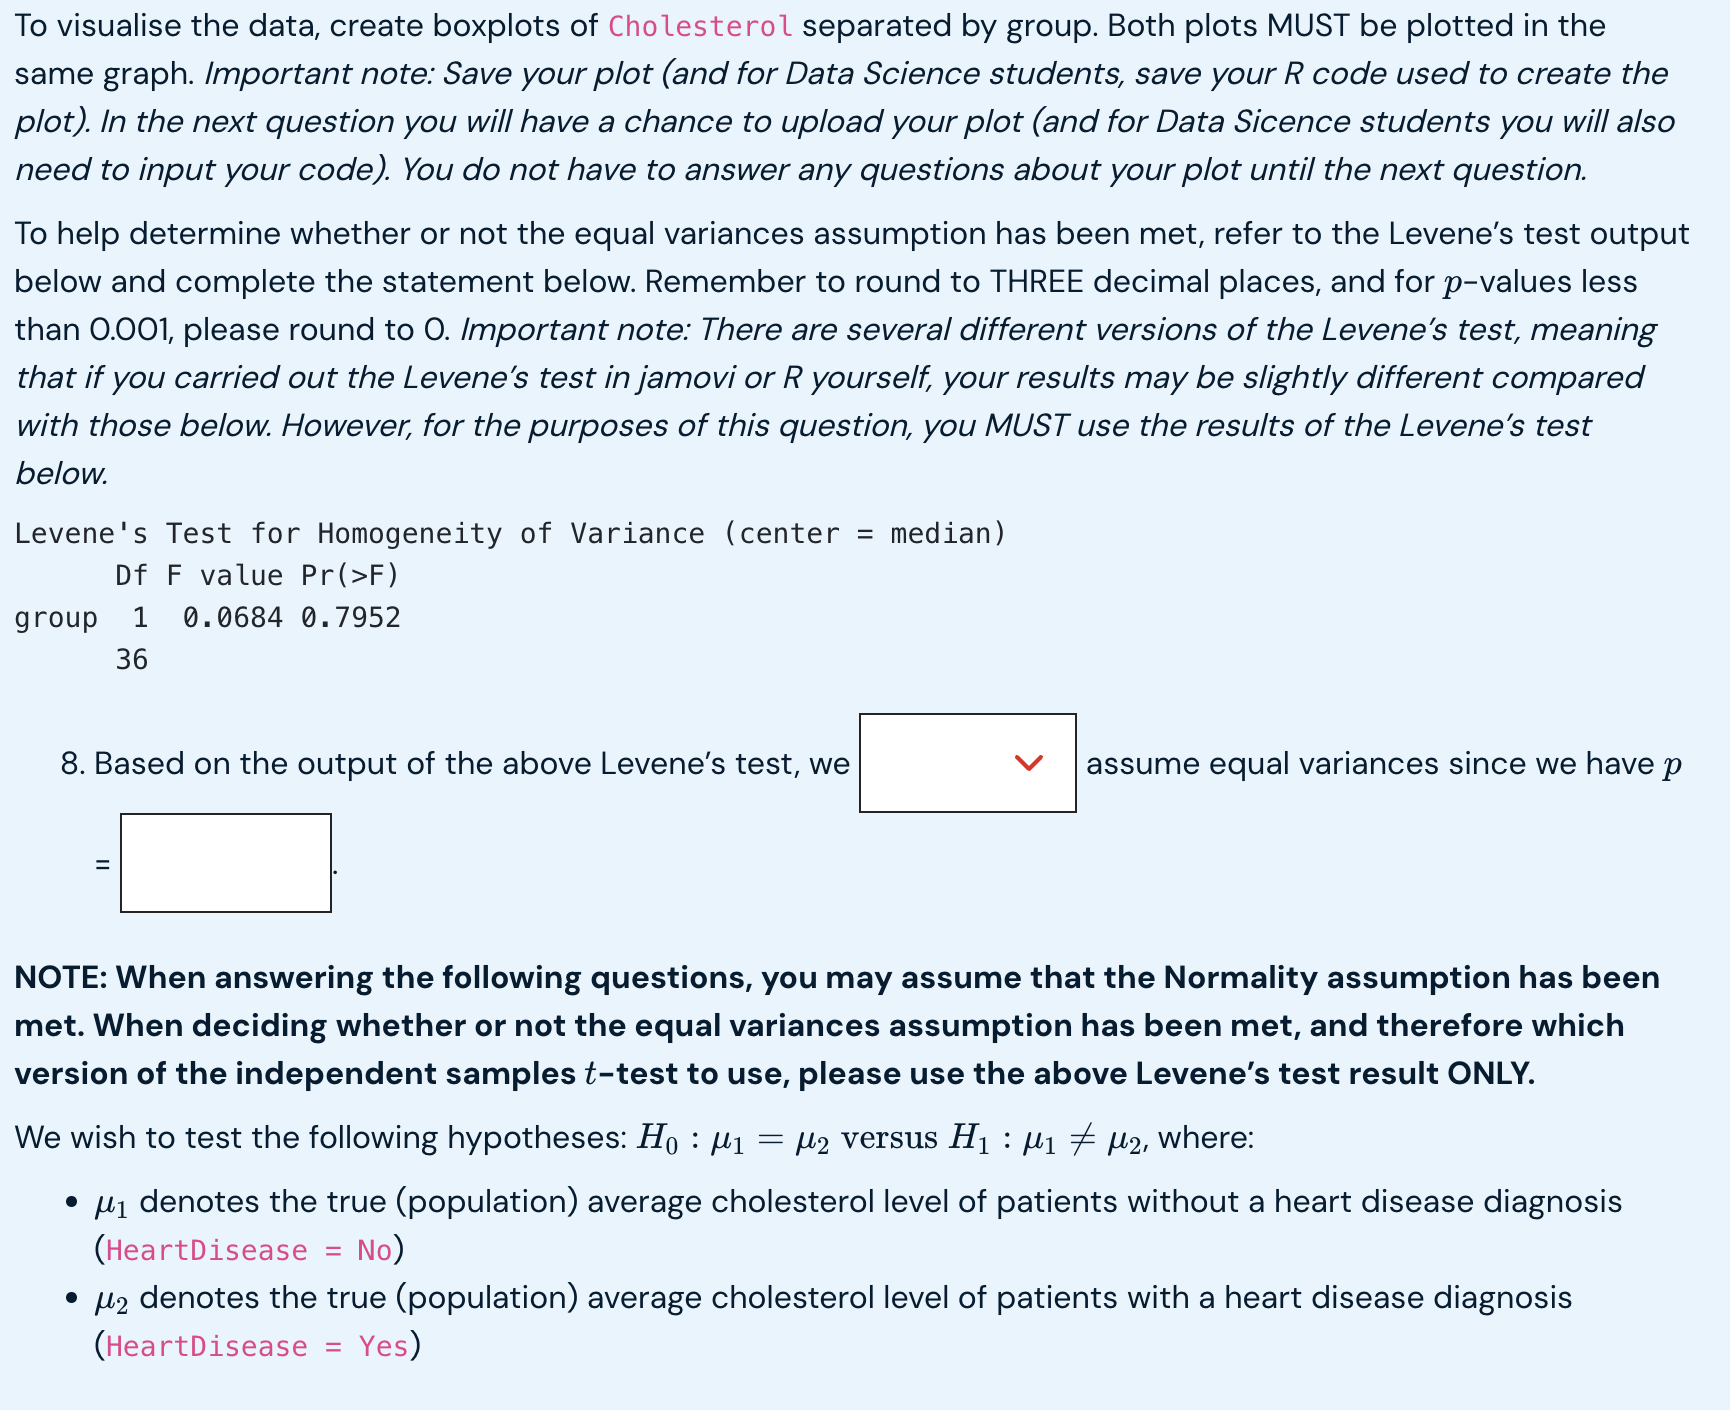
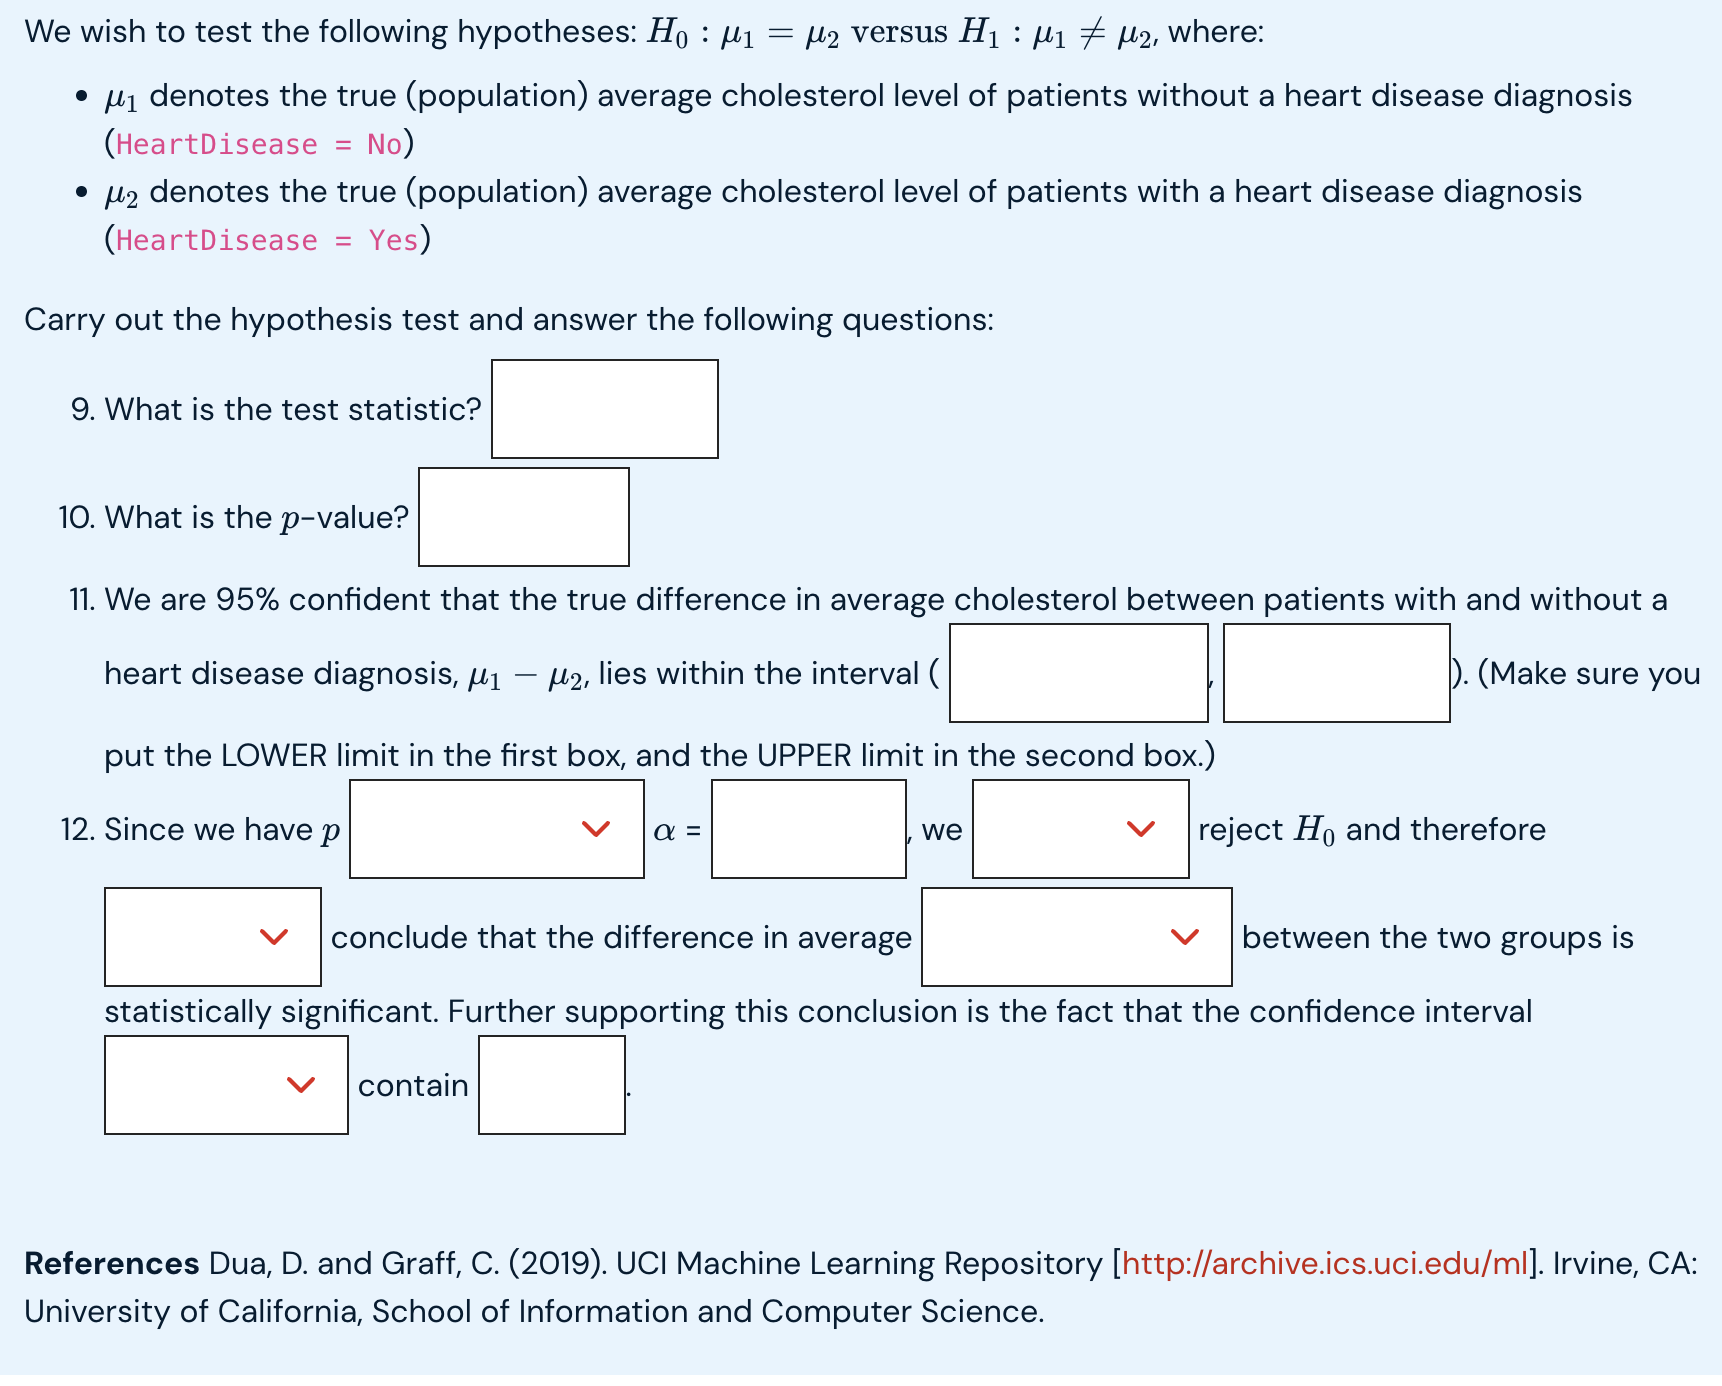
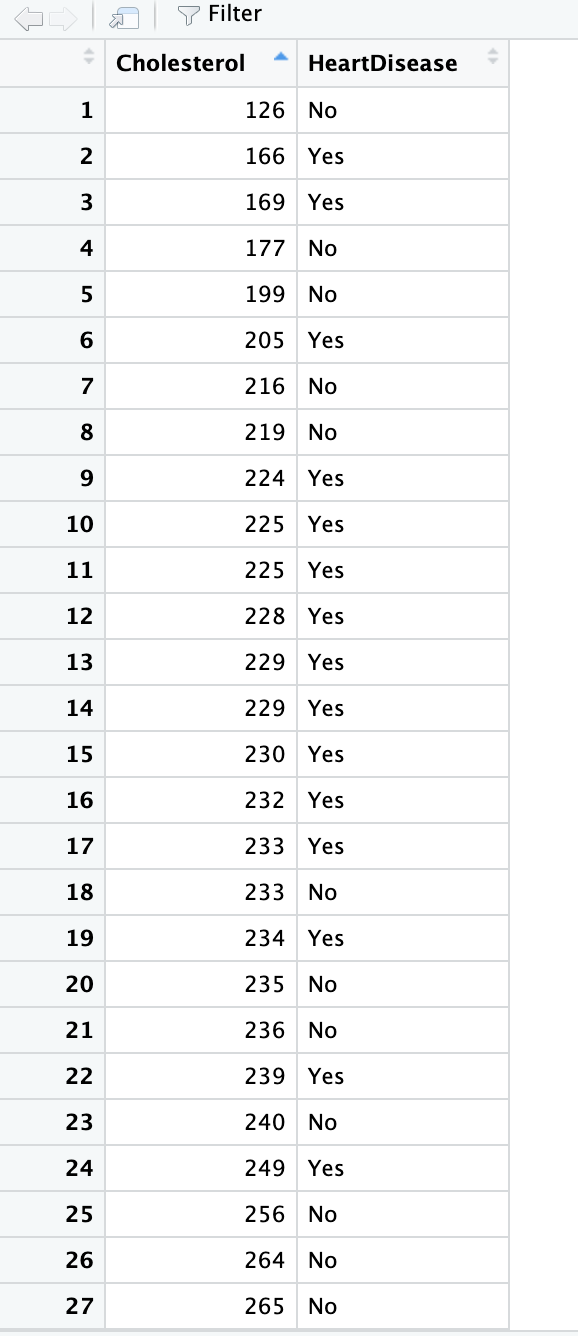
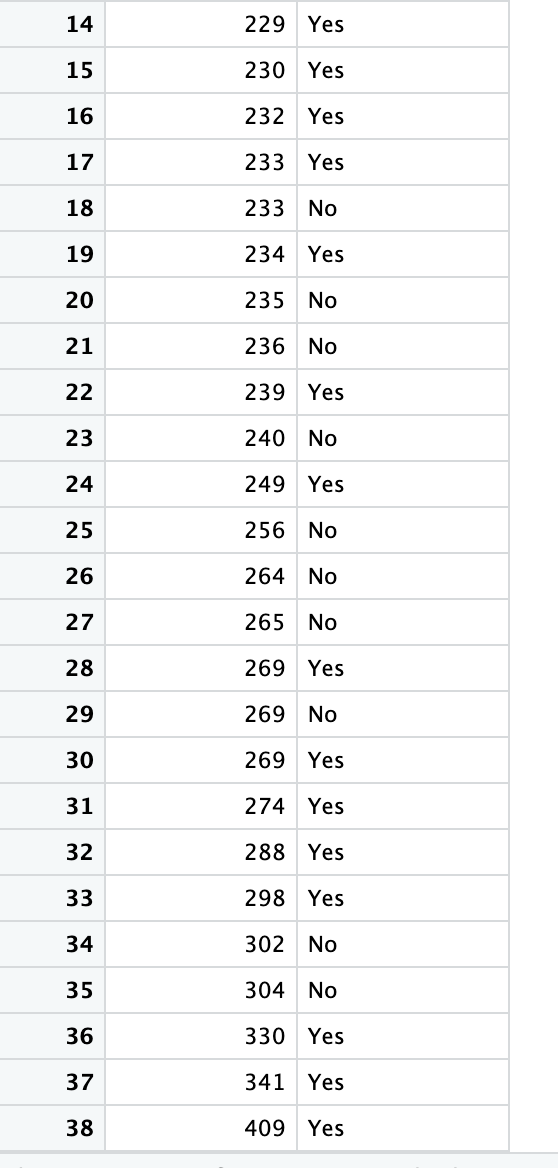
The two columns (variables) in df2. csv contain the following information for 38 patients: Cholesterol: Cholesterol in mg/dl HeartDisease: Heart disease diagnosis (No or Yes) Suppose we wish to use an independent samples t-test to determine whether there is a significant difference in average cholesterol levels between patients with and without a heart disease diagnosis. What follows is a series of questions related to testing this hypothesis. Assume a level of significance of a = 0.05. Carry out the necessary analysis using either jamovi (Sci/Health students) or R (Data Science students) and answer the following questions. Where relevant, round your answers to THREE decimal places. For p-values that are less than 0.00] please round to O. 1. What is the sample size of the No group? El 2. What is the sample size of the Yes group? El 3. What is the sample mean for the No group? :l 4. What is the sample mean for the Yes group? Cl 5. What is the sample standard deviation for the No group? :l 6. What is the sample standard deviation for the Yes group? :l 7. For the independent samples t-test we will be carrying out in this question, which variable is the dependent variable? To visualise the data, create boxplots of Cholesterol separated by group. Both plots MUST be plotted in the same graph. Important note: Save your plot (and for Data Science students, save your R code used to create the plot). In the next question you will have a chance to upload your plot (and for Data Sicence students you will also need to input your code). You do not have to answer any questions about your plot until the next question. To help determine whether or not the equal variances assumption has been met, refer to the Levene's test output below and complete the statement below. Remember to round to THREE decimal places, and for p-values less than 0.001, please round to O. Important note: There are several different versions of the Levene's test, meaning that if you carried out the Levene's test in famovi or R yourself, your results may be slightly different compared with those below. However, for the purposes of this question, you MUST use the results of the Levene's test below. Levene's Test for Homogeneity of Variance (center = median) Df F value Pr(>F) group 1 0.0684 0.7952 36 8. Based on the output of the above Levene's test, we v |assume equal variances since we have p NOTE: When answering the following questions, you may assume that the Normality assumption has been met. When deciding whether or not the equal variances assumption has been met, and therefore which version of the independent samples {-test to use, please use the above Levene's test result ONLY. We wish to test the following hypotheses: H : 1y = us versus Hj : py # o, where: L1 denotes the true (population) average cholesterol level of patients without a heart disease diagnosis (HeartDisease = No) * L5 denotes the true (population) average cholesterol level of patients with a heart disease diagnosis (HeartDisease = Yes) We wish to test the following hypotheses: Ho : M1 = /2 versus H1 : M1 / /2, where: . M] denotes the true (population) average cholesterol level of patients without a heart disease diagnosis (HeartDisease = No) . M2 denotes the true (population) average cholesterol level of patients with a heart disease diagnosis (HeartDisease = Yes) Carry out the hypothesis test and answer the following questions: 9. What is the test statistic? 10. What is the p-value? 11. We are 95% confident that the true difference in average cholesterol between patients with and without a heart disease diagnosis, M1 - /2, lies within the interval ( ). (Make sure you put the LOWER limit in the first box, and the UPPER limit in the second box.) 12. Since we have p a = we V reject Ho and therefore conclude that the difference in average V between the two groups is statistically significant. Further supporting this conclusion is the fact that the confidence interval contain References Dua, D. and Graff, C. (2019). UCI Machine Learning Repository [http://archive.ics.uci.edu/ml]. Irvine, CA: University of California, School of Information and Computer Science.7 Filter Cholesterol HeartDisease 126 No 2 166 Yes W 169 Yes 4 177 No 199 No 6 205 Yes 216 No 8 219 No 9 224 Yes 10 225 Yes 11 225 Yes 12 228 Yes 13 229 Yes 14 229 Yes 15 230 Yes 16 232 Yes 17 233 Yes 18 233 No 19 234 Yes 20 235 No 21 236 No 22 239 Yes 23 240 No 24 249 Yes 25 256 No 26 264 No 27 265 No14 15 16 17 18 19 20 21 22 23 24 25 26 27 28 29 30 31 32 33 34 35 36 37 38 229 230 232 233 233 234 235 236 239 240 249 256 264 265 269 269 269 274 288 298 302 304 330 341 409 Yes Yes Yes Yes No Yes No No Yes No Yes No No No Yes No Yes Yes Yes Yes No No Yes Yes Yes
Step by Step Solution
There are 3 Steps involved in it

Get step-by-step solutions from verified subject matter experts