

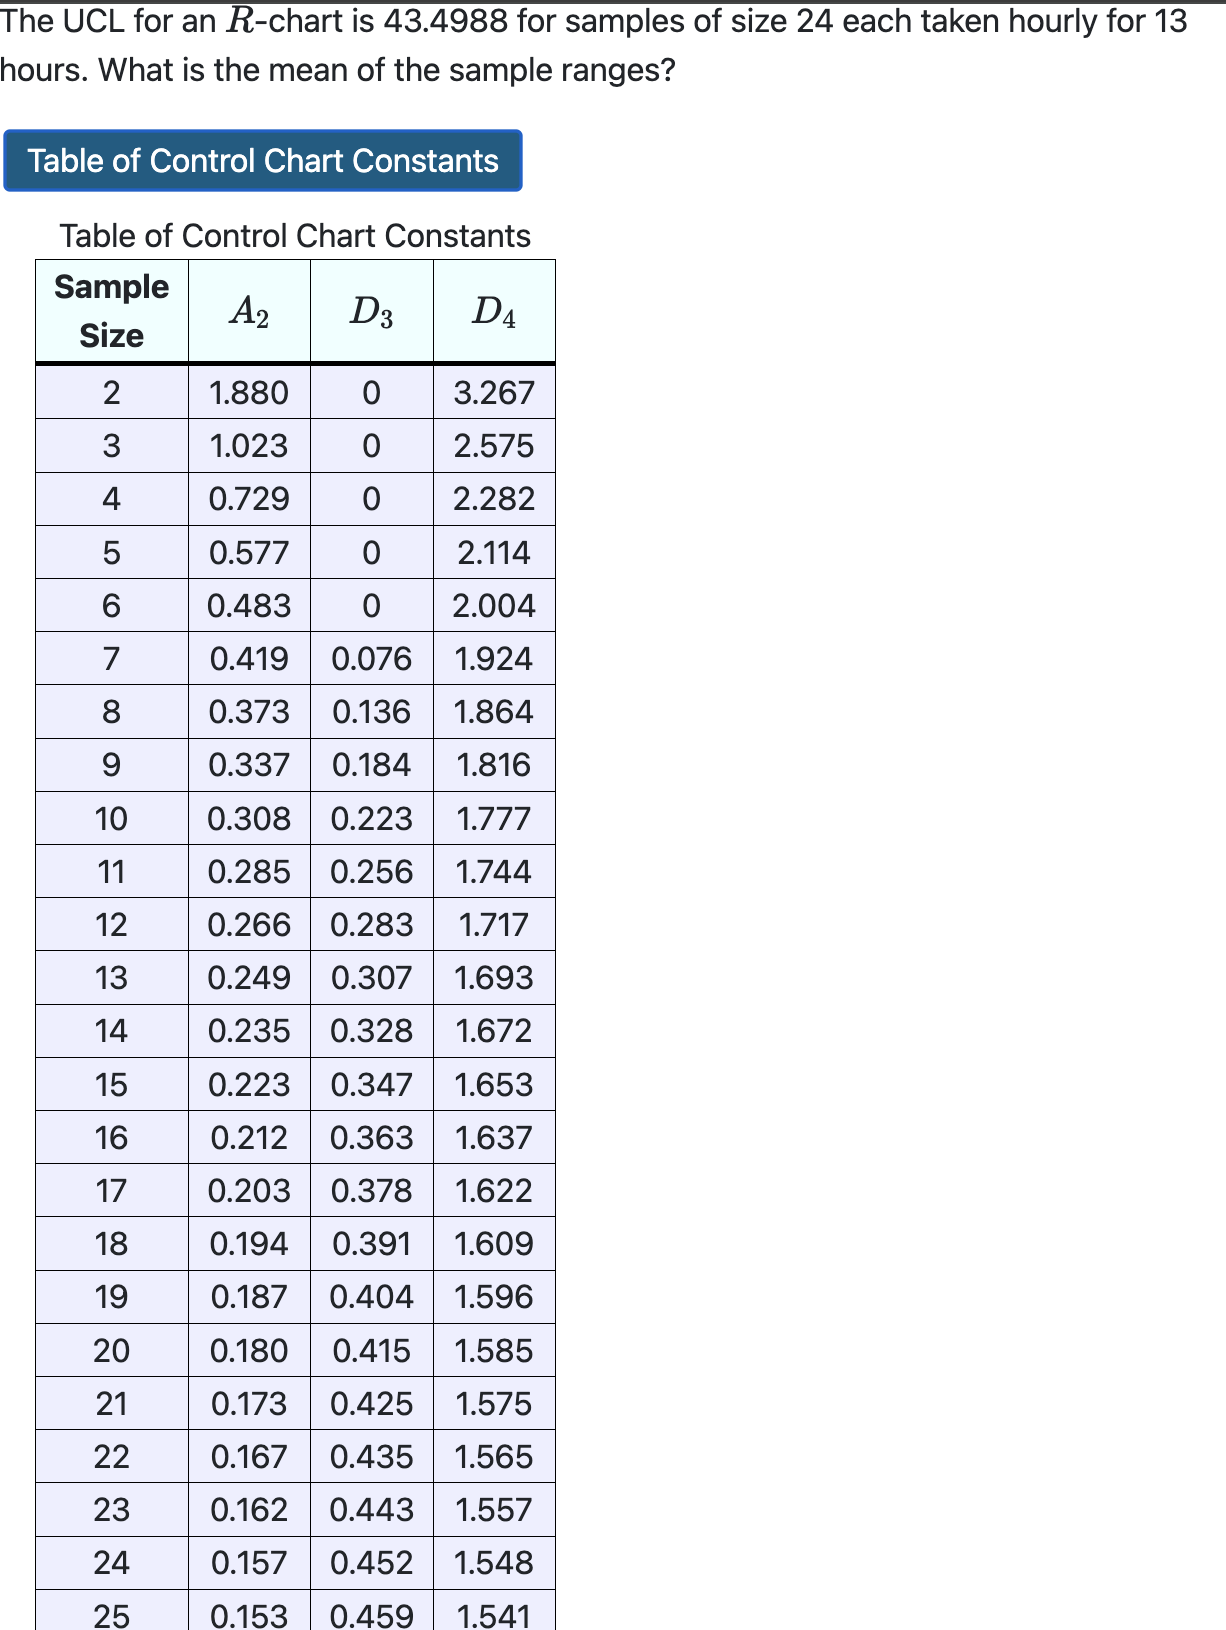
Question: The UCL for an R - chart is 4 3 . 4 9 8 8 for samples of size 2 4 each taken hourly for
The UCL for an chart is for samples of size each taken hourly for
hours. What is the mean of the sample ranges?
Table of Control Chart Constants
Table of Control Chart Constants
Step by Step Solution
There are 3 Steps involved in it
1 Expert Approved Answer
Step: 1 Unlock

Question Has Been Solved by an Expert!
Get step-by-step solutions from verified subject matter experts
Step: 2 Unlock
Step: 3 Unlock