

Question: The value on the far right is EV Q.2b. Draw a rough graph of S-Curves for Activity C showing: PV, EV, and AC. What is
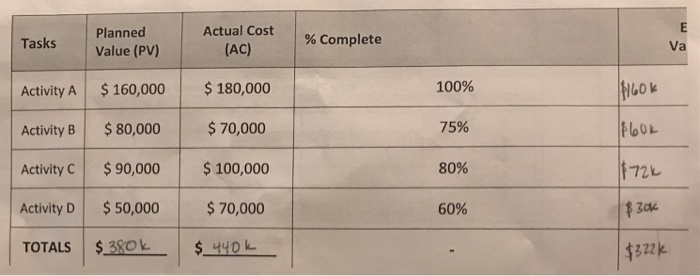
The value on the far right is EV
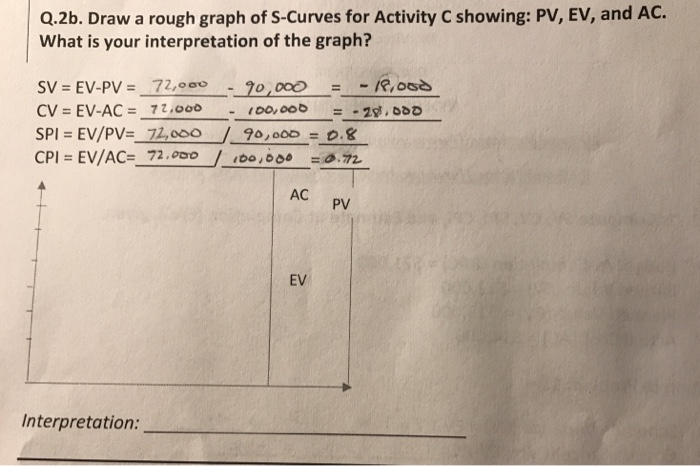
Q.2b. Draw a rough graph of S-Curves for Activity C showing: PV, EV, and AC. What is your interpretation of the graph? SPI = EV/PV= 72,000 CPl = EV / AC- 72.ooo / 90,000 =0.8 /ee.ese =o.n AC PV EV Interpretation
Step by Step Solution
There are 3 Steps involved in it
1 Expert Approved Answer
Step: 1 Unlock

Question Has Been Solved by an Expert!
Get step-by-step solutions from verified subject matter experts
Step: 2 Unlock
Step: 3 Unlock