

The variable # of Influenza Cases in Table 1 located at the end of this question sheet
Question:
The variable # of Influenza Cases in Table 1 located at the end of this question sheet measures the number of influenza cases, in 2019, per 1 million members of the population for a country. This data was collected from the World Health Organization (WHO) website, https://www.who.int/en/. For this question you are going to choose another variable measured for the countries listed in Table 1 to see whether your chosen variable correlates with the number of influenza cases. Marks will not be allocated according to whether there is correlation present, but whether the data collected is appropriate. For the data to be appropriate the following must hold: • The data you collect for this question needs to be easily accessible, for us to check, for at least 10 of the countries that are listed in Table 1. This also means that the data must be actual measurements associated with these countries. • The data you collect must be measured for the year 2019 or a year close to 2019. Also, the variable must be in the same units for each of the countries. For example, if you choose a variable that is measured per 10 million members of the population for one country, then you need to also record the data for all other countries in units of per 10 million members of the population. Complete the following questions. (a) Briefly describe below the new variable that you have chosen including (i) the units it is measured in and (ii) where you found the data.(b) At the end of this question sheet you will find Table 1. Enter the values that you have collected for your new variable under the columns called New variable where the new variable value for each country needs to appear in the space provided to the immediate right of the country name. (4 marks) (c) Enter the data from your completed Table 1, including the data for your new variable, into Excel and create a scatterplot of the two variables making sure that you include appropriate axis labels. Copy and paste this scatterplot into your assignment solutions document. (4 marks) (d) Using Excel, calculate the correlation between these two variables. What is it equal to and what Excel formula did you use to obtain it? (6 marks) (e) Provide some brief comments on what you see in the scatterplot and also on what you think the correlation value tells you. For example, does there appear to be a linear relationship between the two variables?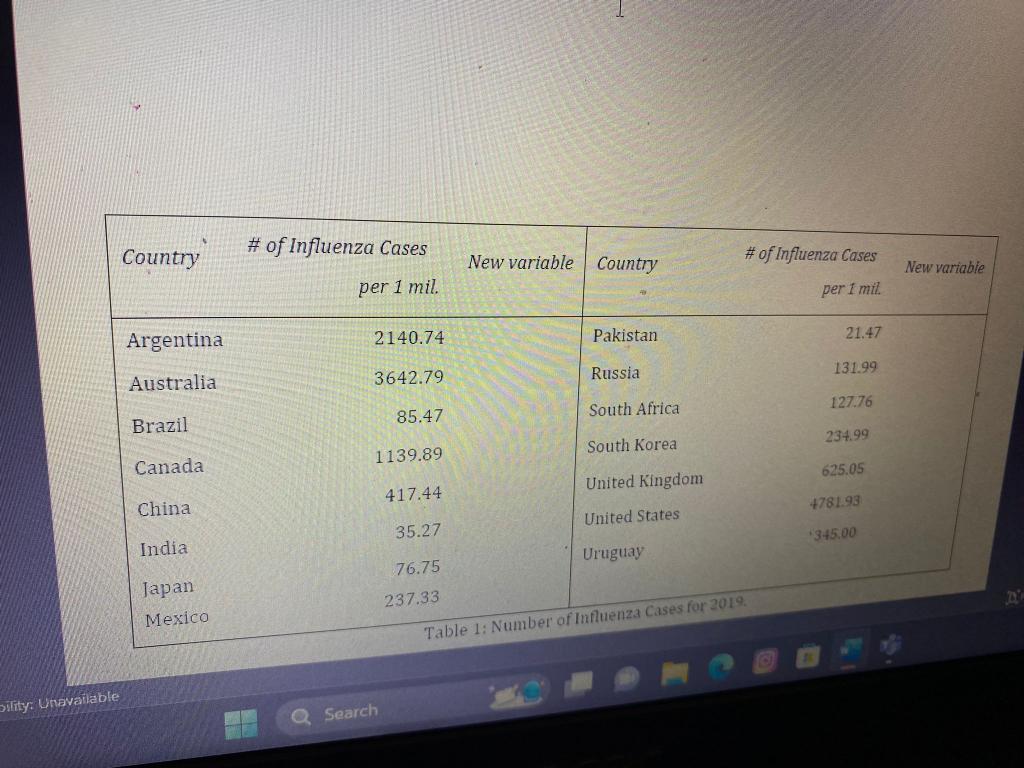
Expert Answer:
Analyzing Correlation Between Influenza Cases and Another Variable Heres how you can approach this question a Choosing a New Variable New Variable Population Density people per square kilometer i Unit... View the full answer


College Mathematics for Business Economics Life Sciences and Social Sciences
ISBN: 978-0321614001
12th edition
Authors: Raymond A. Barnett, Michael R. Ziegler, Karl E. Byleen
