

Question: The variable shown on the vertical axis is The units for the variable on the horizontal axis are There are two ways to view

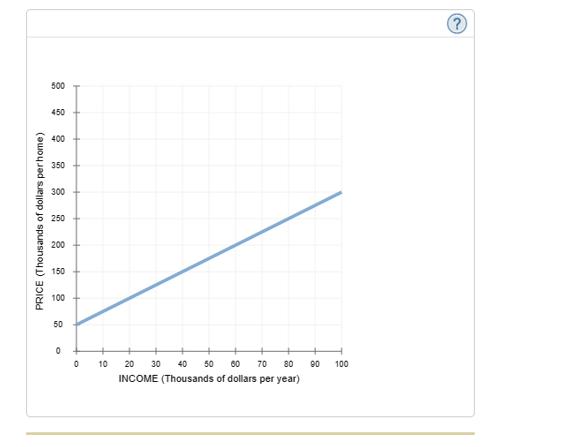
The variable shown on the vertical axis is The units for the variable on the horizontal axis are There are two ways to view the information presented on the graph. First, the graph tells us the amount a person with a certain income is likely to spend on a home, and second, it tells us the probable income of a person who spent a certain amount on a home. For example, if an individual earned $50,000 last year and purchased a new home, you would expect that person to have paid about for the home. Similarly, if someone just paid $250,000 for a home, you could use this graph to estimate that this person's income was probably around PRICE (Thousands of dollars per home) 500 450 400 350 300 250 200 150 100 50 0 0 10 + 50 60 70 80 20 30 INCOME (Thousands of dollars per year) 40 90 100
Step by Step Solution
3.45 Rating (164 Votes )
There are 3 Steps involved in it
Variable on vertical axis is Price unit is thousand ... View full answer

Get step-by-step solutions from verified subject matter experts