

Question: The velocity vs. time graph for an object moving along a straight path is shown in Figure below. i) Find the average acceleration of
 |
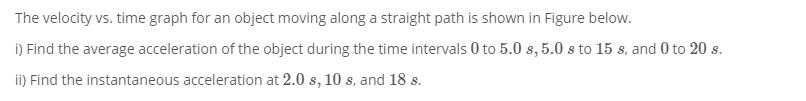
The velocity vs. time graph for an object moving along a straight path is shown in Figure below. i) Find the average acceleration of the object during the time intervals 0 to 5.0 s, 5.0 s to 15 s, and 0 to 20 s. ii) Find the instantaneous acceleration at 2.0 s, 10 s, and 18 s. T (m/s) 8 4 0 -4 -8 5 10 15 20 t(s)
Step by Step Solution
★★★★★
3.46 Rating (149 Votes )
There are 3 Steps involved in it
1 Expert Approved Answer
Step: 1 Unlock

Question Has Been Solved by an Expert!
Get step-by-step solutions from verified subject matter experts
Step: 2 Unlock
Step: 3 Unlock