

Question: The Virtual hhmi Biolnteractive Introduction Notebook Progress Reference Help Save/Resume Stickleback Evolution Lab Howard Hughes Medical Institute Experiment 1: Analyze Stickleback Fish from Lakes Background
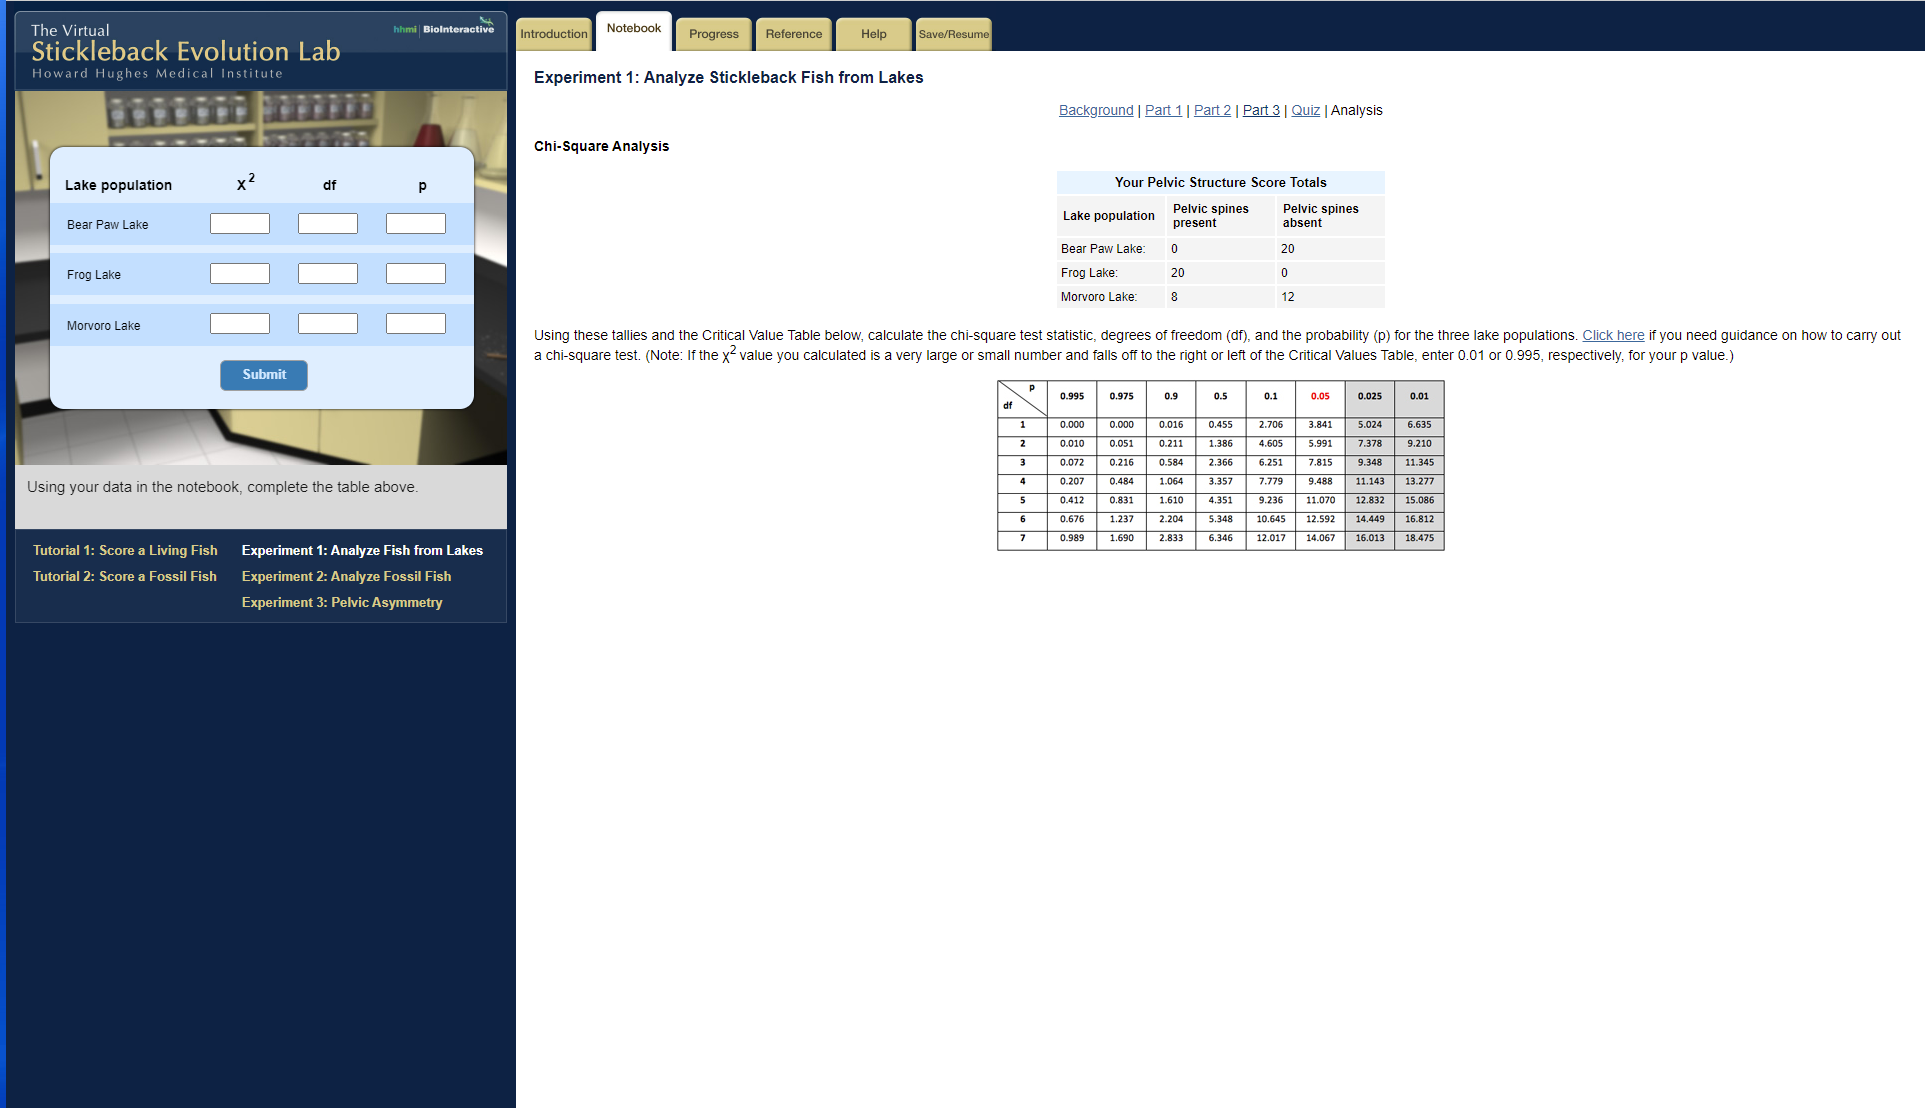
The Virtual hhmi Biolnteractive Introduction Notebook Progress Reference Help Save/Resume Stickleback Evolution Lab Howard Hughes Medical Institute Experiment 1: Analyze Stickleback Fish from Lakes Background | Part 1 | Part 2 | Part 3 | Quiz | Analysis Chi-Square Analysis Lake population x 2 Your Pelvic Structure Score Totals Bear Paw Lake Lake population Pelvic spines Pelvic spines present absent Bear Paw Lake: 20 Frog Lake Frog Lake: 20 Morvoro Lake: 12 Morvoro Lake Using these tallies and the Critical Value Table below, calculate the chi-square test statistic, degrees of freedom (df), and the probability (p) for the three lake populations. Click here if you need guidance on how to carry out a chi-square test. (Note: If the x" value you calculated is a very large or small number and falls off to the right or left of the Critical Values Table, enter 0.01 or 0.995, respectively, for your p value.) Submit 0.995 0.975 0.9 0.5 0.1 0.05 0.025 0.01 0.000 0.000 0.016 0.455 2.706 3.841 5.024 6.635 0.010 0.051 0.211 1.386 4.605 5.991 7.378 9.210 0.072 0.216 0.584 2.366 6.251 7.815 9.348 11.345 Using your data in the notebook, complete the table above. 0.207 0.484 1.064 3.357 7.779 9.488 11.143 13.277 0.412 0.831 1.610 4.351 9.236 11.070 12.832 15.086 0.676 1.237 2.204 5.348 10.645 12.592 14.449 16.812 Tutorial 1: Score a Living Fish Experiment 1: Analyze Fish from Lakes 0.989 1.690 2.833 6.346 12.017 14.067 16.013 18.475 Tutorial 2: Score a Fossil Fish Experiment 2: Analyze Fossil Fish Experiment 3: Pelvic Asymmetry
Step by Step Solution
There are 3 Steps involved in it

Get step-by-step solutions from verified subject matter experts