

Question: The visualization in this exercise represents a break-even analysis for Pops Planes., a small passenger airline, catering to tourists travelling between Hawaiian Islands. The break-even
The visualization in this exercise represents a break-even analysis for Pops Planes., a small passenger airline, catering to tourists travelling between Hawaiian Islands. The break-even analysis shows the number of passengers (units) in the left column and sales dollars in the right column for each month of the fiscal year. The blue portion of the bar charts represents the number of units (left) or dollars (right) required each month to break even while the grey portion represents the actual units or dollars sold each month. The percentage values in the center represent the extent to which actual sales exceeded break-even sales. Finally, the center column compares actual sales to break-even sales based on company management expectations as follows:
- Not meeting or exceeding break-even sales of less than 50% is below expectations (red dot).
- Exceeding break-even sales from 50% to 100% is meeting expectations (yellow dot).
- Exceeding break-even sales greater than 100% is exceeding expectations (green dot).
Use the information in the dashboard to answer the following questions.
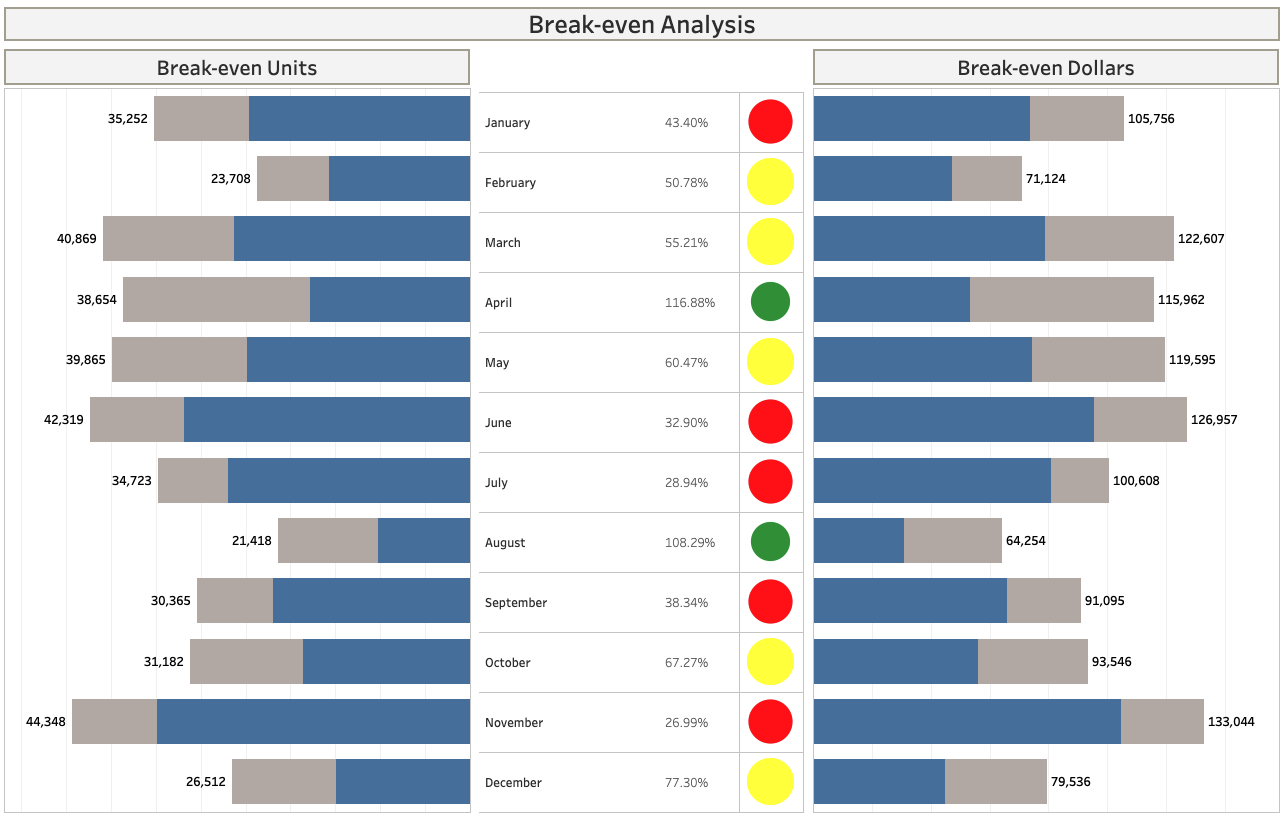
40,869 35,252 38,654 39,865 42,319 44,348 34,723 Break-even Units 30,365 31,182 23,708 Break-even Analysis January 43.40% Break-even Dollars February 50.78% 71,124 March 55.21% April 116.88% May 60.47% June 32.90% July 28.94% 21,418 August 108.29% 64,254 September 38.34% October 67.27% November 26.99% 105,756 100,608 91,095 26,512 December 77.30% 79,536 93,546 122,607 115,962 119,595 126,957 133,044
Step by Step Solution
There are 3 Steps involved in it
Based on the provided breakeven analysis for Pops Planes we can answer the following questions 1 Wha... View full answer

Get step-by-step solutions from verified subject matter experts