

Question: The v-t graphs on Speeding Up and Slowing Down shown just before this question [review those graphs before answering] were strictlyr plotted in the negative
![before this question [review those graphs before answering] were strictlyr plotted in](https://s3.amazonaws.com/si.experts.images/answers/2024/06/6667d3c3dfcfa_4516667d3c3cc3c1.jpg)
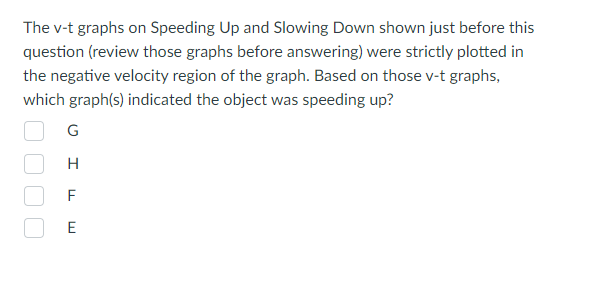
The v-t graphs on Speeding Up and Slowing Down shown just before this question [review those graphs before answering] were strictlyr plotted in the negative velocity region of the graph. Based on those v-t graphs, which graph{s] indicated the object was speeding up
Step by Step Solution
There are 3 Steps involved in it
1 Expert Approved Answer
Step: 1 Unlock

Question Has Been Solved by an Expert!
Get step-by-step solutions from verified subject matter experts
Step: 2 Unlock
Step: 3 Unlock