

Question: The WACC spreadsheet provides a tool for understanding the calculation of WACC and the affect in changes of the components of WACC. The spreadsheet automates
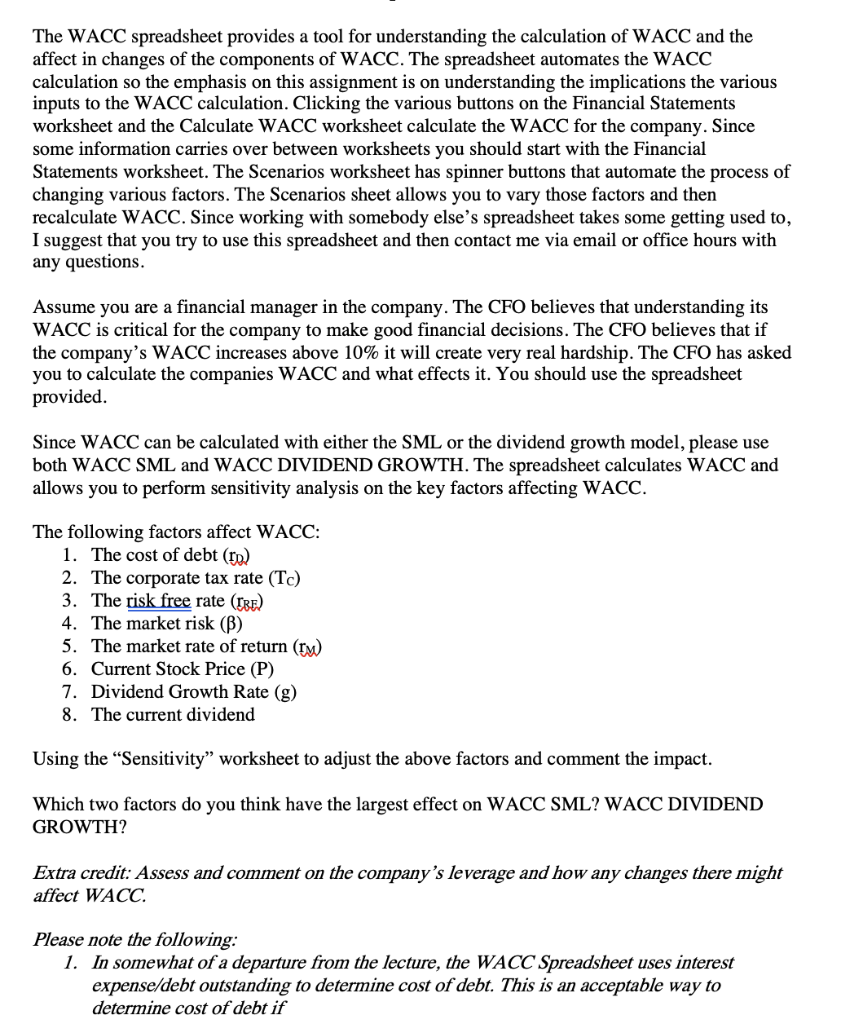
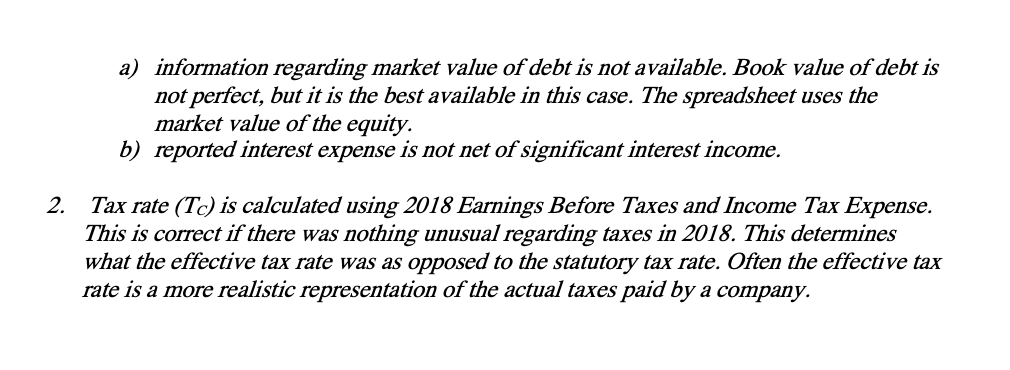
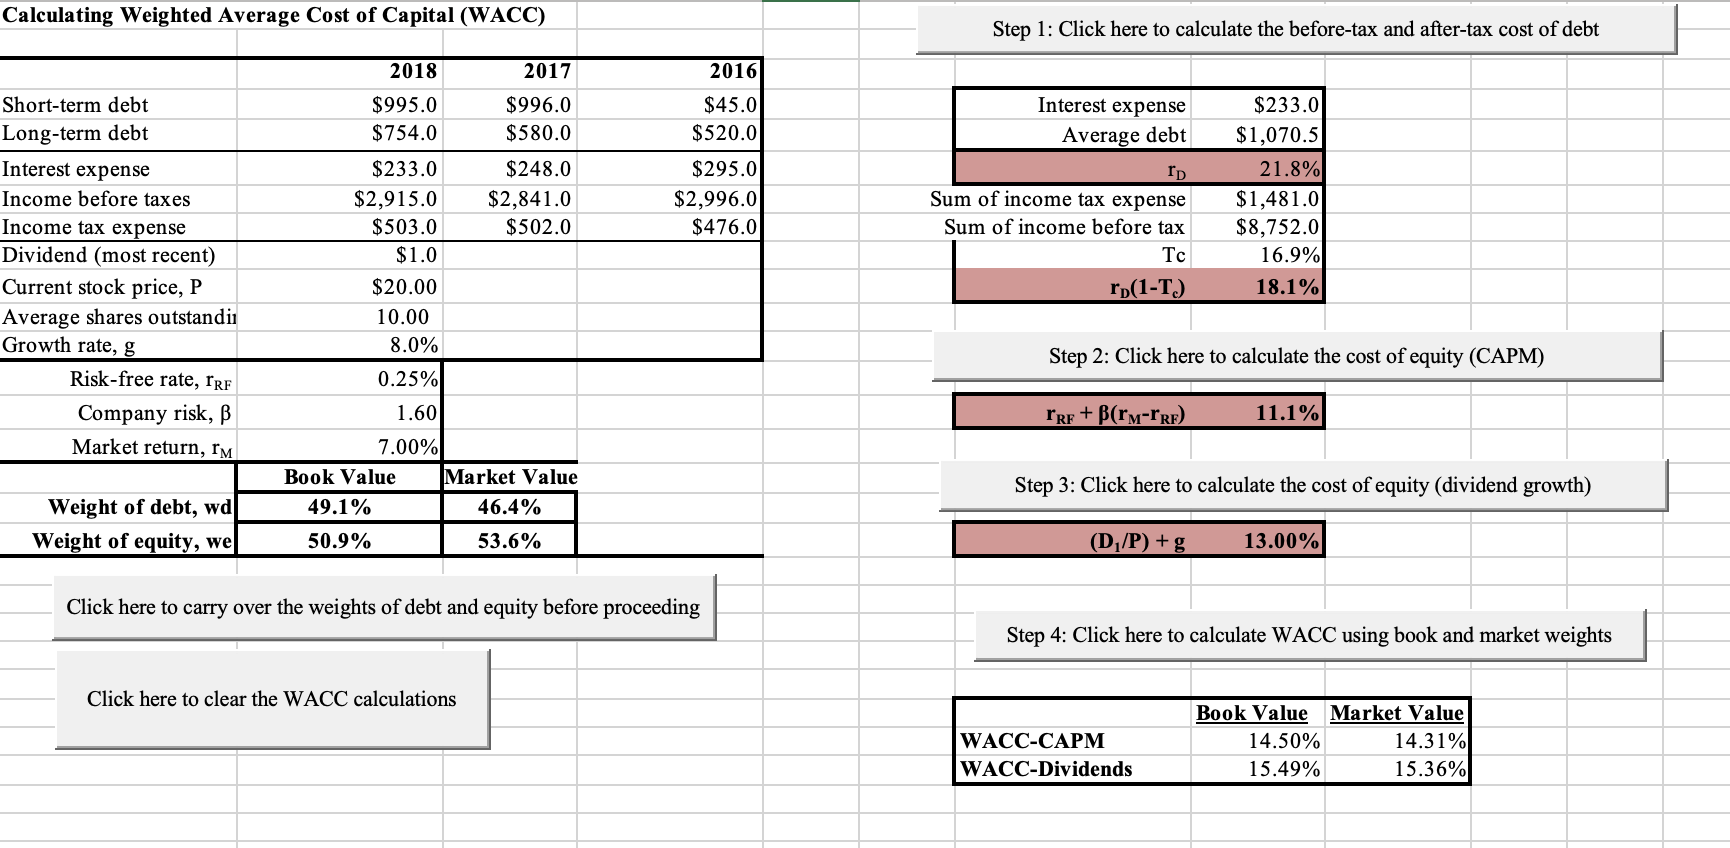
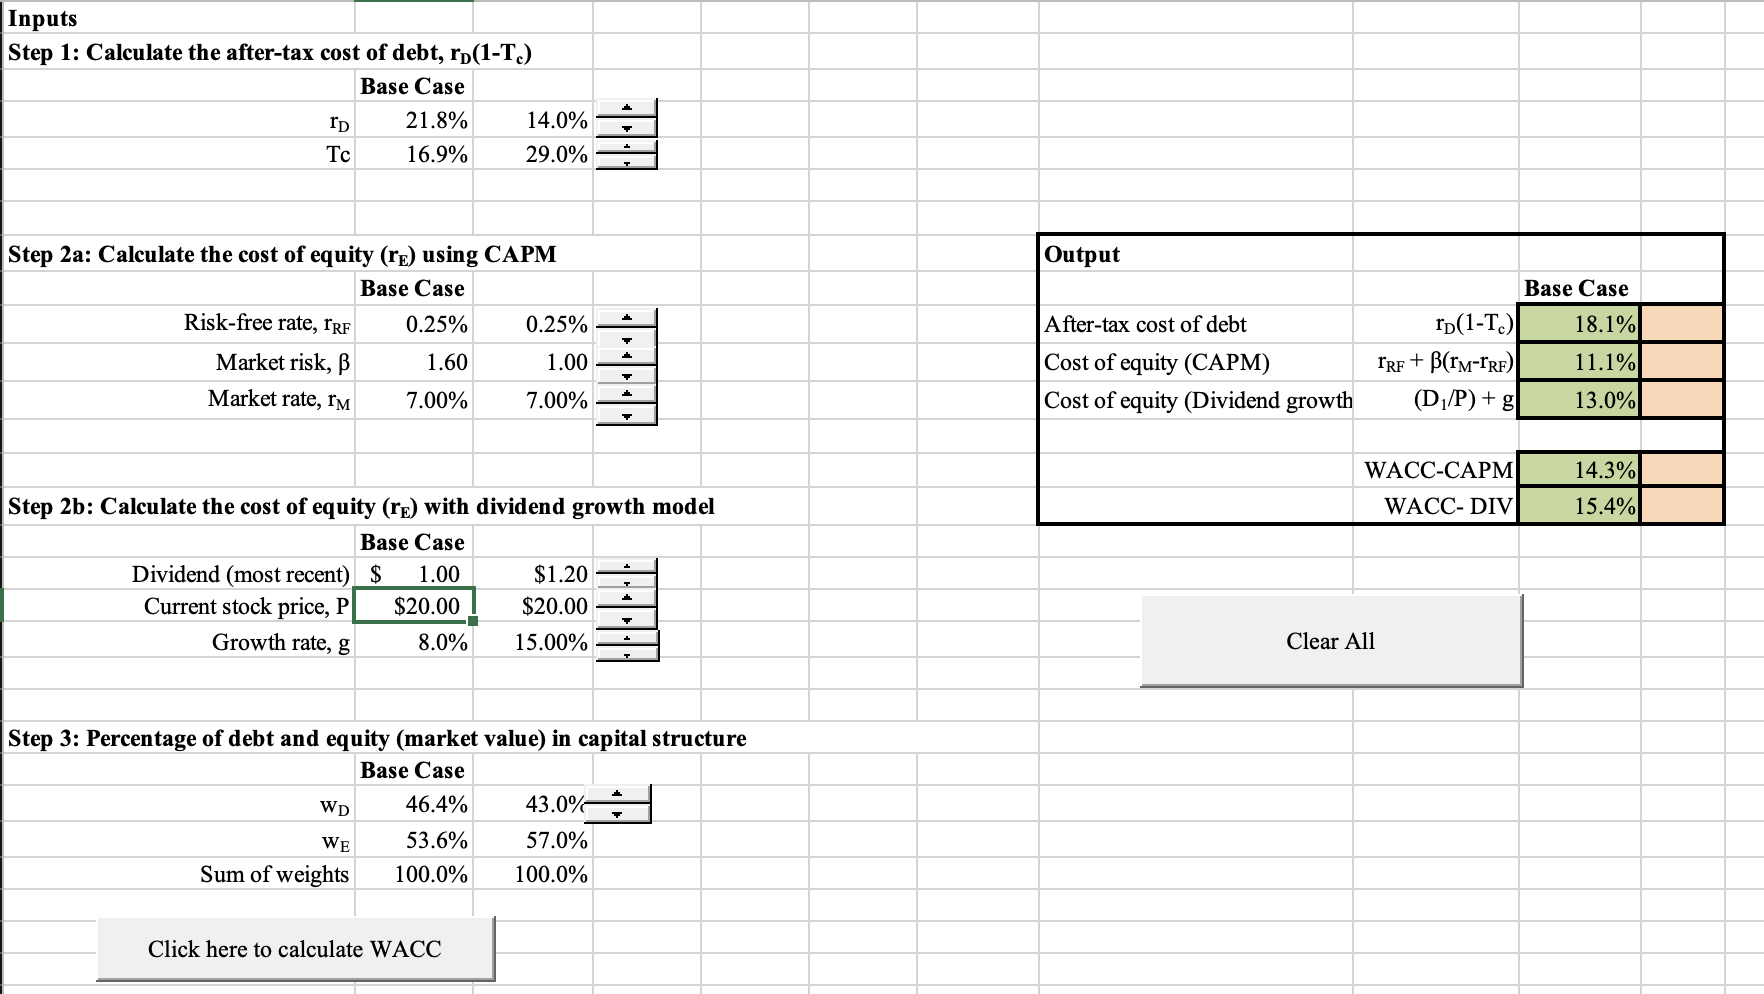
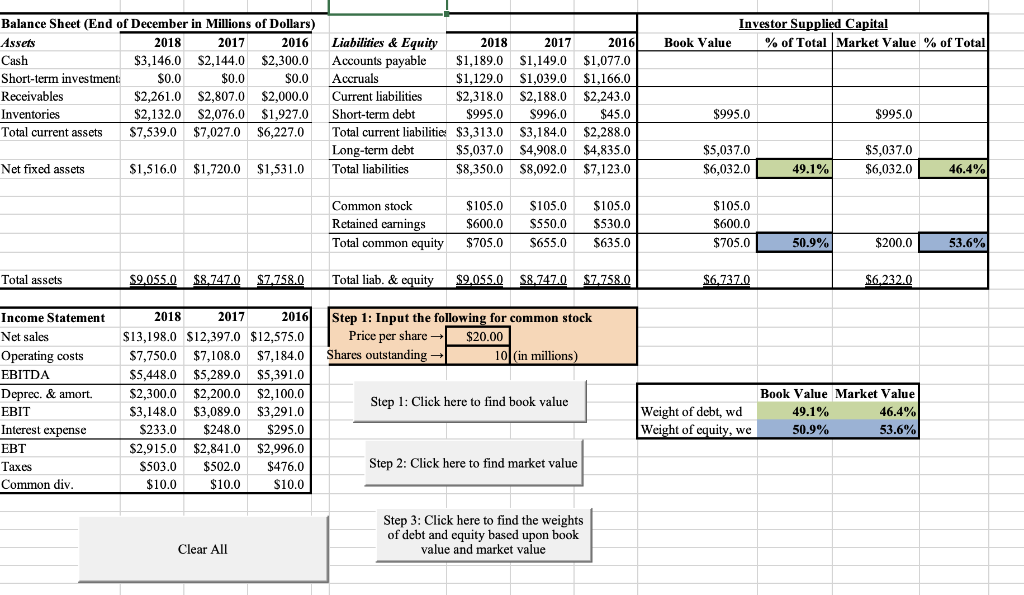
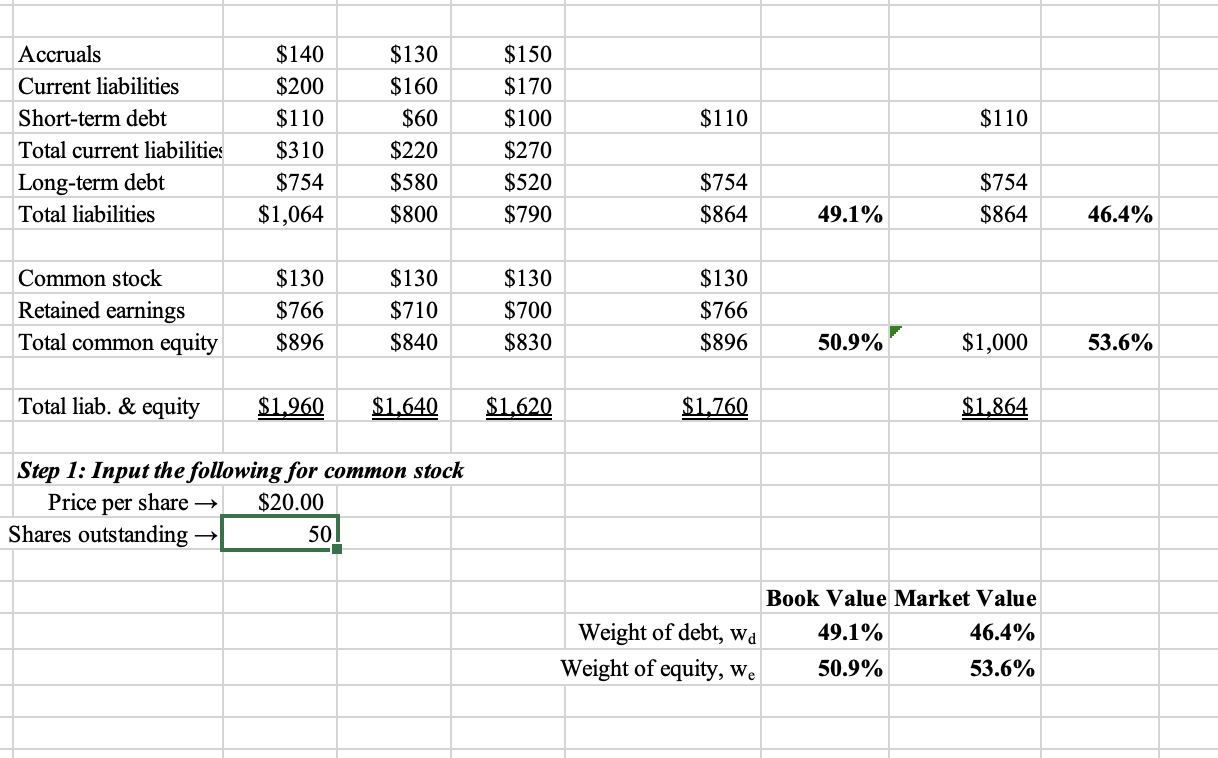
The WACC spreadsheet provides a tool for understanding the calculation of WACC and the affect in changes of the components of WACC. The spreadsheet automates the WACC calculation so the emphasis on this assignment is on understanding the implications the various inputs to the WACC calculation. Clicking the various buttons on the Financial Statements worksheet and the Calculate WACC worksheet calculate the WACC for the company. Since some information carries over between worksheets you should start with the Financial Statements worksheet. The Scenarios worksheet has spinner buttons that automate the process of changing various factors. The Scenarios sheet allows you to vary those factors and then recalculate WACC. Since working with somebody else's spreadsheet takes some getting used to, I suggest that you try to use this spreadsheet and then contact me via email or office hours with any questions. Assume you are a financial manager in the company. The CFO believes that understanding its WACC is critical for the company to make good financial decisions. The CFO believes that if the company's WACC increases above 10% it will create very real hardship. The CFO has asked you to calculate the companies WACC and what effects it. You should use the spreadsheet provided. Since WACC can be calculated with either the SML or the dividend growth model, please use both WACC SML and WACC DIVIDEND GROWTH. The spreadsheet calculates WACC and allows you to perform sensitivity analysis on the key factors affecting WACC. The following factors affect WACC: 1. The cost of debt (ID) 2. The corporate tax rate (TC) 3. The risk free rate (CBE) 4. The market risk (B) 5. The market rate of return (TM) 6. Current Stock Price (P) 7. Dividend Growth Rate (g) 8. The current dividend Using the Sensitivity" worksheet to adjust the above factors and comment the impact. Which two factors do you think have the largest effect on WACC SML? WACC DIVIDEND GROWTH? Extra credit: Assess and comment on the company's leverage and how any changes there might affect WACC. Please note the following: 1. In somewhat of a departure from the lecture, the WACC Spreadsheet uses interest expense/debt outstanding to determine cost of debt. This is an acceptable way to determine cost of debt if a) information regarding market value of debt is not available. Book value of debt is not perfect, but it is the best available in this case. The spreadsheet uses the market value of the equity. b) reported interest expense is not net of significant interest income. 2. Tax rate (Tc) is calculated using 2018 Earnings Before Taxes and Income Tax Expense. This is correct if there was nothing unusual regarding taxes in 2018. This determines what the effective tax rate was as opposed to the statutory tax rate. Often the effective tax rate is a more realistic representation of the actual taxes paid by a company. Calculating Weighted Average Cost of Capital (WACC) Step 1: Click here to calculate the before-tax and after-tax cost of debt 2018 2017 2016 Interest expense $995.0 $754.0 $45.0 $520.0 Average debt $996.0 $580.0 $248.0 $2,841.0 $502.0 $295.0 $2,996.0 $476.0 Short-term debt Long-term debt Interest expense Income before taxes Income tax expense Dividend (most recent) Current stock price, P Average shares outstandi Growth rate, g Risk-free rate, IRF Company risk, B Market return, I'm $233.0 $2,915.0 $503.0 $1.0 $20.00 10.00 8.0% 0.25% rp Sum of income tax expense Sum of income before tax Tc r}(1-T) $233.0 $1,070.5 21.8% $1,481.0 $8,752.0 16.9% 18.1% Step 2: Click here to calculate the cost of equity (CAPM) 1.60 rrf + B(rm-rRF) 11.1% 7.00% Book Value Market Value 49.1% 46.4% 50.9% 53.6% Step 3: Click here to calculate the cost of equity (dividend growth) Weight of debt, wd Weight of equity, we (D/P) +g 13.00% Click here to carry over the weights of debt and equity before proceeding Step 4: Click here to calculate WACC using book and market weights Click here to clear the WACC calculations WACC-CAPM WACC-Dividends Book Value Market Value 14.50% 14.31% 15.49% 15.36% Inputs Step 1: Calculate the after-tax cost of debt, rp(1-T.) Base Case ID 21.8% 14.0% c 16.9% 29.0% Output Step 2a: Calculate the cost of equity (re) using CAPM Base Case Risk-free rate, IRF 0.25% 0.25% Market risk, 1.60 Market rate, IM 7.00% 7.00% After-tax cost of debt Base Case Id(1-T.) 18.1% IRF + B(rm-) 11.1% (D/P) +g 13.0% 1.00 Cost of equity (CAPM) Cost of equity (Dividend growth 14.3% WACC-CAPM WACC-DIV 15.4% Step 2b: Calculate the cost of equity (re) with dividend growth model Base Case Dividend (most recent) $ 1.00 $1.20 Current stock price, P $20.00 $20.00 Growth rate, g 8.0% 15.00% Clear All Step 3: Percentage of debt and equity (market value) in capital structure Base Case WD 46.4% 43.0% WE 53.6% 57.0% Sum of weights 100.0% 100.0% Click here to calculate WACC Investor Supplied Capital Book Value % of Total Market Value % of Total Balance Sheet (End of December in Millions of Dollars) Assets 2018 2017 2016 Cash $3,146.0 $2,144.0 $2,300.0 Short-term investment $0.0 $0.0 $0.0 Receivables $2,261.0 $2,807,0 $2,000.0 Inventories $2,132.0 $2,076.0 $1,927.0 Total current assets $7,539.0 $7,027.0 $6,227.0 Liabilities & Equity 2018 2017 2016 Accounts payable $1,189.0 $1,149,0 $1,077.0 Accruals $1,129.0 $1,039.0 $1,166.0 Current liabilities $2,318.0 $2,188.0 $2,243.0 Short-term debt $995.0 $996.0 $45.0 Total current liabilitie: $3,313.0 $3,184.0 $2,288.0 Long-term debt $5,037.0 $4,908.0 $4,835.0 Total liabilities $8,350.0 $8,092.0 $7,123.0 $995.0 $995.0 $5,037.0 $6,032.0 $5,037.0 $6,032.0 Net fixed assets $1,516.0 $1,720.0 $1,531.0 49.1% 46.4% Common stock Retained earnings Total common equity $105.0 $600.0 $705.0 $105.0 $550.0 $655.0 $105.0 $530,0 $635.0 $105.0 $600.0 $705.0 50.9% $200.0 53.6% Total assets $9.055.0 $8.747.0 $7.7580 Total liab. & equity $9.055.0 $8.7470 $7,758.0 $6.7370 $6.232.0 Step 1: Input the following for common stock Price per share $20.00 Shares outstanding 10 (in millions) Income Statement Net sales Operating costs EBITDA Deprec. & amort. EBIT 2018 2017 2016 $13,198.0 $12,397.0 $12,575.0 $7,750.0 $7,108.0 $7,184.0 $5,448.0 $5,289.0 $5,391.0 $2,300.0 $2,200.0 $2,100.0 $3,148.0 $3,089.0 $3,291.0 $233.0 $248.0 $295.0 $2,915.0 $2,841.0 $2,996.0 SS03.0 $502.0 $476.0 $10.0 $10.0 $10.0 Step 1: Click here to find book value Book Value Market Value Weight of debt, wd 49.1% 46.4% Weight of equity, we 50.9% 53.6% Interest expense EBT Taxes Common div. Step 2: Click here to find market value Step 3: Click here to find the weights of debt and equity based upon book value and market value Clear All $110 $110 Accruals Current liabilities Short-term debt Total current liabilities Long-term debt Total liabilities $140 $200 $110 $310 $754 $1,064 $130 $160 $60 $220 $580 $800 $150 $170 $100 $270 $520 $790 $754 $864 $754 $864 49.1% 46.4% Common stock Retained earnings Total common equity $130 $766 $896 $130 $710 $840 $130 $700 $830 $130 $766 $896 50.9% $1,000 53.6% Total liab. & equity $1.960 $1,640 $1,620 $1.760 $1.864 Step 1: Input the following for common stock Price per share $20.00 Shares outstanding 50 Book Value Market Value Weight of debt, wa 49.1% 46.4% Weight of equity, we 50.9% 53.6% The WACC spreadsheet provides a tool for understanding the calculation of WACC and the affect in changes of the components of WACC. The spreadsheet automates the WACC calculation so the emphasis on this assignment is on understanding the implications the various inputs to the WACC calculation. Clicking the various buttons on the Financial Statements worksheet and the Calculate WACC worksheet calculate the WACC for the company. Since some information carries over between worksheets you should start with the Financial Statements worksheet. The Scenarios worksheet has spinner buttons that automate the process of changing various factors. The Scenarios sheet allows you to vary those factors and then recalculate WACC. Since working with somebody else's spreadsheet takes some getting used to, I suggest that you try to use this spreadsheet and then contact me via email or office hours with any questions. Assume you are a financial manager in the company. The CFO believes that understanding its WACC is critical for the company to make good financial decisions. The CFO believes that if the company's WACC increases above 10% it will create very real hardship. The CFO has asked you to calculate the companies WACC and what effects it. You should use the spreadsheet provided. Since WACC can be calculated with either the SML or the dividend growth model, please use both WACC SML and WACC DIVIDEND GROWTH. The spreadsheet calculates WACC and allows you to perform sensitivity analysis on the key factors affecting WACC. The following factors affect WACC: 1. The cost of debt (ID) 2. The corporate tax rate (TC) 3. The risk free rate (CBE) 4. The market risk (B) 5. The market rate of return (TM) 6. Current Stock Price (P) 7. Dividend Growth Rate (g) 8. The current dividend Using the Sensitivity" worksheet to adjust the above factors and comment the impact. Which two factors do you think have the largest effect on WACC SML? WACC DIVIDEND GROWTH? Extra credit: Assess and comment on the company's leverage and how any changes there might affect WACC. Please note the following: 1. In somewhat of a departure from the lecture, the WACC Spreadsheet uses interest expense/debt outstanding to determine cost of debt. This is an acceptable way to determine cost of debt if a) information regarding market value of debt is not available. Book value of debt is not perfect, but it is the best available in this case. The spreadsheet uses the market value of the equity. b) reported interest expense is not net of significant interest income. 2. Tax rate (Tc) is calculated using 2018 Earnings Before Taxes and Income Tax Expense. This is correct if there was nothing unusual regarding taxes in 2018. This determines what the effective tax rate was as opposed to the statutory tax rate. Often the effective tax rate is a more realistic representation of the actual taxes paid by a company. Calculating Weighted Average Cost of Capital (WACC) Step 1: Click here to calculate the before-tax and after-tax cost of debt 2018 2017 2016 Interest expense $995.0 $754.0 $45.0 $520.0 Average debt $996.0 $580.0 $248.0 $2,841.0 $502.0 $295.0 $2,996.0 $476.0 Short-term debt Long-term debt Interest expense Income before taxes Income tax expense Dividend (most recent) Current stock price, P Average shares outstandi Growth rate, g Risk-free rate, IRF Company risk, B Market return, I'm $233.0 $2,915.0 $503.0 $1.0 $20.00 10.00 8.0% 0.25% rp Sum of income tax expense Sum of income before tax Tc r}(1-T) $233.0 $1,070.5 21.8% $1,481.0 $8,752.0 16.9% 18.1% Step 2: Click here to calculate the cost of equity (CAPM) 1.60 rrf + B(rm-rRF) 11.1% 7.00% Book Value Market Value 49.1% 46.4% 50.9% 53.6% Step 3: Click here to calculate the cost of equity (dividend growth) Weight of debt, wd Weight of equity, we (D/P) +g 13.00% Click here to carry over the weights of debt and equity before proceeding Step 4: Click here to calculate WACC using book and market weights Click here to clear the WACC calculations WACC-CAPM WACC-Dividends Book Value Market Value 14.50% 14.31% 15.49% 15.36% Inputs Step 1: Calculate the after-tax cost of debt, rp(1-T.) Base Case ID 21.8% 14.0% c 16.9% 29.0% Output Step 2a: Calculate the cost of equity (re) using CAPM Base Case Risk-free rate, IRF 0.25% 0.25% Market risk, 1.60 Market rate, IM 7.00% 7.00% After-tax cost of debt Base Case Id(1-T.) 18.1% IRF + B(rm-) 11.1% (D/P) +g 13.0% 1.00 Cost of equity (CAPM) Cost of equity (Dividend growth 14.3% WACC-CAPM WACC-DIV 15.4% Step 2b: Calculate the cost of equity (re) with dividend growth model Base Case Dividend (most recent) $ 1.00 $1.20 Current stock price, P $20.00 $20.00 Growth rate, g 8.0% 15.00% Clear All Step 3: Percentage of debt and equity (market value) in capital structure Base Case WD 46.4% 43.0% WE 53.6% 57.0% Sum of weights 100.0% 100.0% Click here to calculate WACC Investor Supplied Capital Book Value % of Total Market Value % of Total Balance Sheet (End of December in Millions of Dollars) Assets 2018 2017 2016 Cash $3,146.0 $2,144.0 $2,300.0 Short-term investment $0.0 $0.0 $0.0 Receivables $2,261.0 $2,807,0 $2,000.0 Inventories $2,132.0 $2,076.0 $1,927.0 Total current assets $7,539.0 $7,027.0 $6,227.0 Liabilities & Equity 2018 2017 2016 Accounts payable $1,189.0 $1,149,0 $1,077.0 Accruals $1,129.0 $1,039.0 $1,166.0 Current liabilities $2,318.0 $2,188.0 $2,243.0 Short-term debt $995.0 $996.0 $45.0 Total current liabilitie: $3,313.0 $3,184.0 $2,288.0 Long-term debt $5,037.0 $4,908.0 $4,835.0 Total liabilities $8,350.0 $8,092.0 $7,123.0 $995.0 $995.0 $5,037.0 $6,032.0 $5,037.0 $6,032.0 Net fixed assets $1,516.0 $1,720.0 $1,531.0 49.1% 46.4% Common stock Retained earnings Total common equity $105.0 $600.0 $705.0 $105.0 $550.0 $655.0 $105.0 $530,0 $635.0 $105.0 $600.0 $705.0 50.9% $200.0 53.6% Total assets $9.055.0 $8.747.0 $7.7580 Total liab. & equity $9.055.0 $8.7470 $7,758.0 $6.7370 $6.232.0 Step 1: Input the following for common stock Price per share $20.00 Shares outstanding 10 (in millions) Income Statement Net sales Operating costs EBITDA Deprec. & amort. EBIT 2018 2017 2016 $13,198.0 $12,397.0 $12,575.0 $7,750.0 $7,108.0 $7,184.0 $5,448.0 $5,289.0 $5,391.0 $2,300.0 $2,200.0 $2,100.0 $3,148.0 $3,089.0 $3,291.0 $233.0 $248.0 $295.0 $2,915.0 $2,841.0 $2,996.0 SS03.0 $502.0 $476.0 $10.0 $10.0 $10.0 Step 1: Click here to find book value Book Value Market Value Weight of debt, wd 49.1% 46.4% Weight of equity, we 50.9% 53.6% Interest expense EBT Taxes Common div. Step 2: Click here to find market value Step 3: Click here to find the weights of debt and equity based upon book value and market value Clear All $110 $110 Accruals Current liabilities Short-term debt Total current liabilities Long-term debt Total liabilities $140 $200 $110 $310 $754 $1,064 $130 $160 $60 $220 $580 $800 $150 $170 $100 $270 $520 $790 $754 $864 $754 $864 49.1% 46.4% Common stock Retained earnings Total common equity $130 $766 $896 $130 $710 $840 $130 $700 $830 $130 $766 $896 50.9% $1,000 53.6% Total liab. & equity $1.960 $1,640 $1,620 $1.760 $1.864 Step 1: Input the following for common stock Price per share $20.00 Shares outstanding 50 Book Value Market Value Weight of debt, wa 49.1% 46.4% Weight of equity, we 50.9% 53.6%
Step by Step Solution
There are 3 Steps involved in it

Get step-by-step solutions from verified subject matter experts