

Question: The write up should be no more thans and in the following format.The primary research questions are posted below.The Summary should include answers to these
The write up should be no more thans and in the following format.The primary research questions are posted below.The Summary should include answers to these questions and provide summary results for items that are asked for.
? QUESTION:State clearly the primary research question(s) in terms of the variables available.These questions and tasks are noted below.You should not simply state the questions, but should craft them for a summary report.
? METHODS:Describe the methods (statistical/modeling devices) and technology that you used to create the report.
? RESULTS: Report results in a manner consistent with a publication addressed to a professional audience.Include useful tabular and graphical summaries that relate to the problem in the appendix.Make sure to label with titles.
? DISCUSSION and CONCLUSIONS:Focus this part of your response on the problem's specific questions and the statistical methodologies that served them.Also comment on any limitations of the findings.
It can be single and 12-point font.If you use someone else's ideas to support your own or have information that needs to be cited (stats, figures, graphs, etc...) be sure to cite it.
Data: Came from espn.com, rivals.com, and USA today. We are specifically looking at what predicts total revenue for a public college football program using performance information from games, conference affiliation, and recruiting information.
Outcome: Total Revenue
Covariates: Wins, Power 5 (Y/N), 3rd down conversion rate (%), POINTS, PLAYS, YARDS_GM, TOTAL GAIN TOV, TOTAL LOST TOV, TOTAL First Downs, Score Rate (Red Zone) PTSALLOW, TOTAL 3/4/5 Stars, AVG Stars
** THE PAPER SHOULD BE IN THE FORMAT NOTED ABOVE - you can put answers to these questions inside of results and discussion/conclusions, but it should be written as a summary report NOT as a document in Q and A format.Below are questions and tasks that should be used to construct the summary report noting that the investigator has requested that these items be addressed.
The idea of this report is to give you some experience about how to make and report model results for a study to help understand research questions that someone might want answered.Follow the directions above and with each question when creating your summary report.
Question/Tasks:
1) I need a summary table with all variables that include the following items (see below).You can use this formatting to make your table.This gives you an idea of what type of data you have.
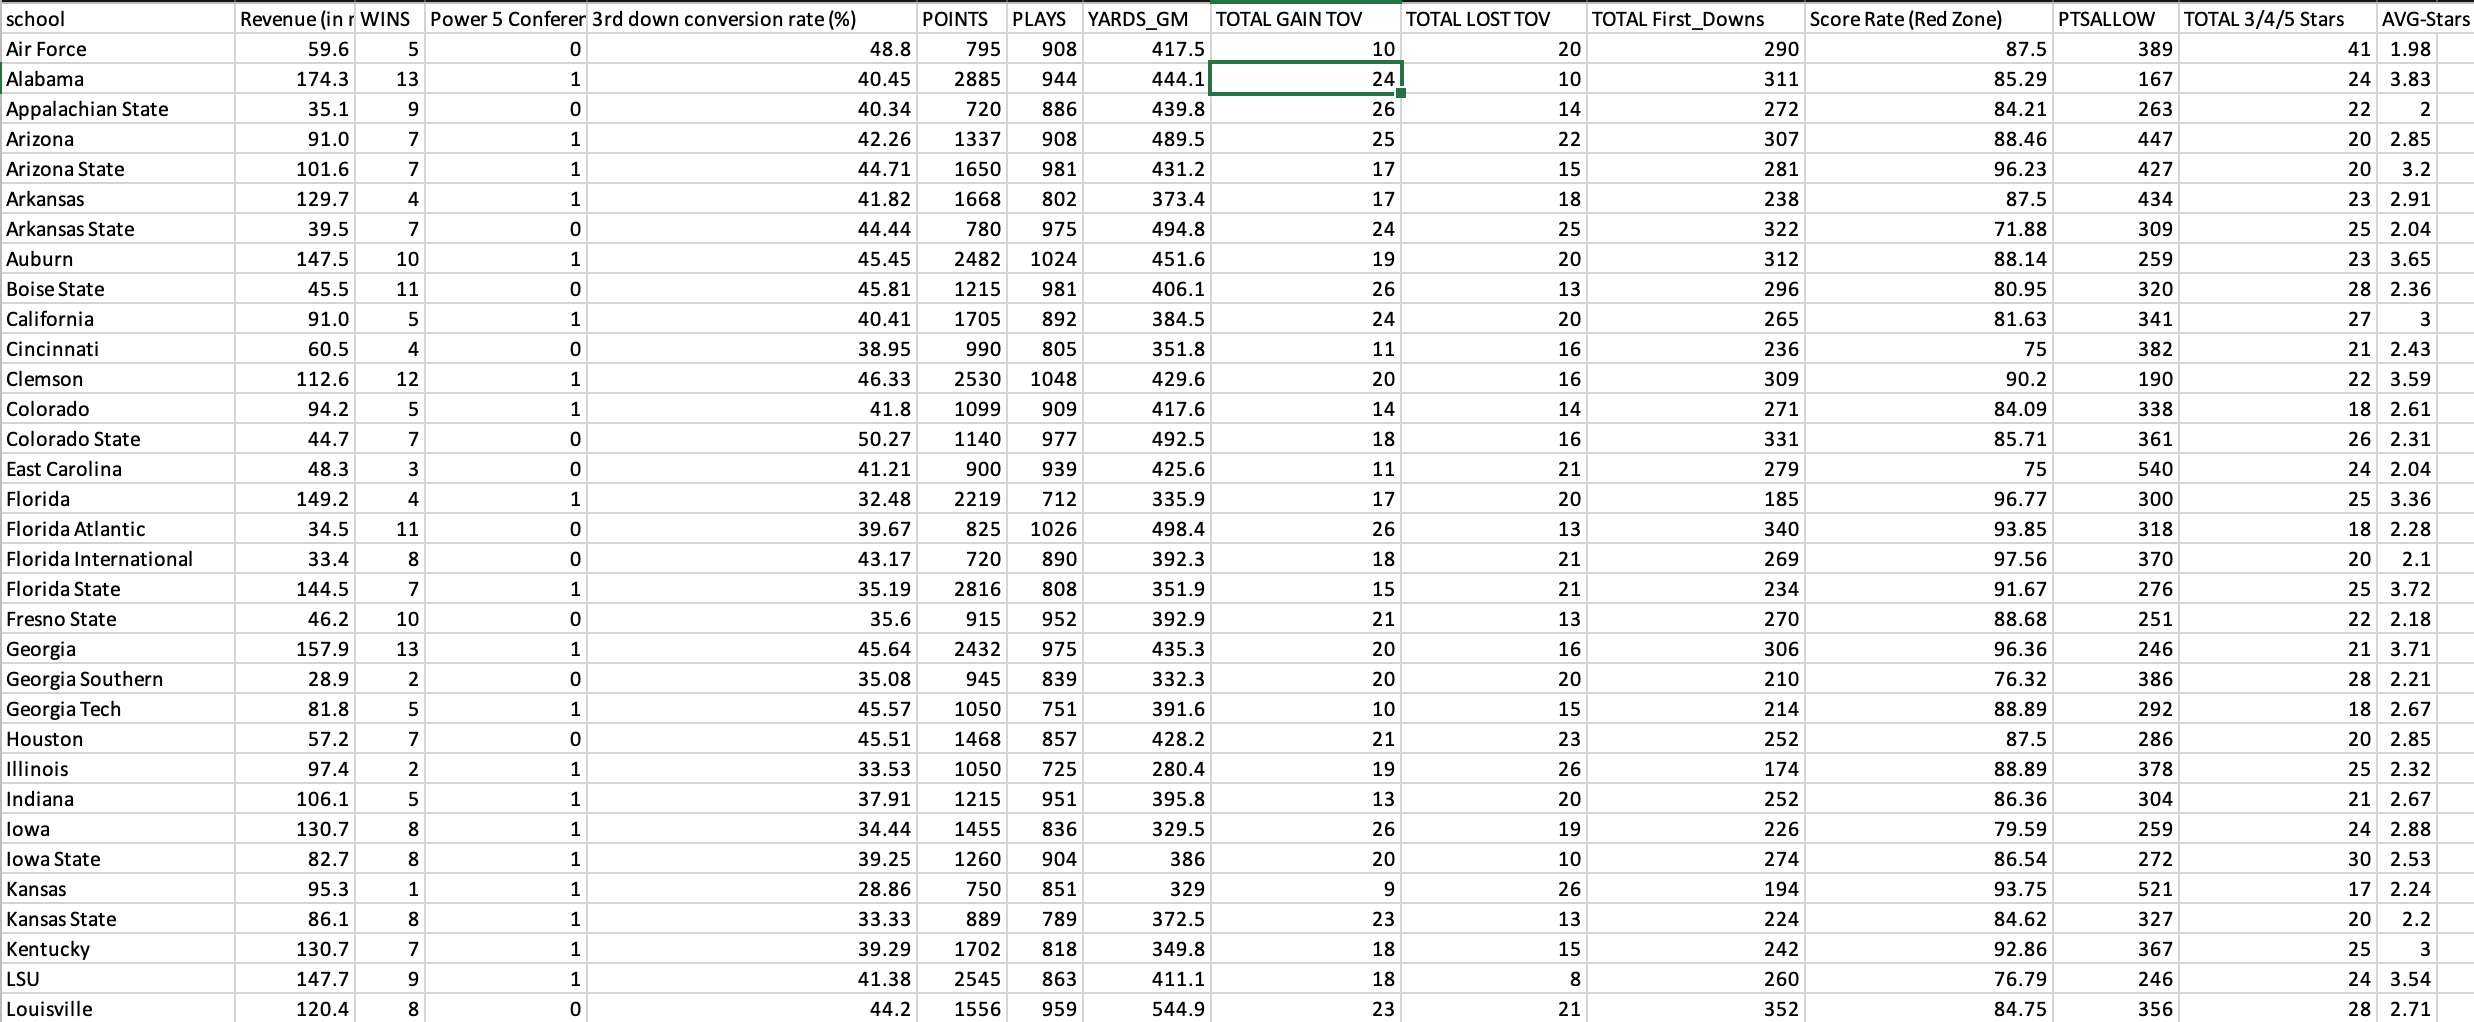
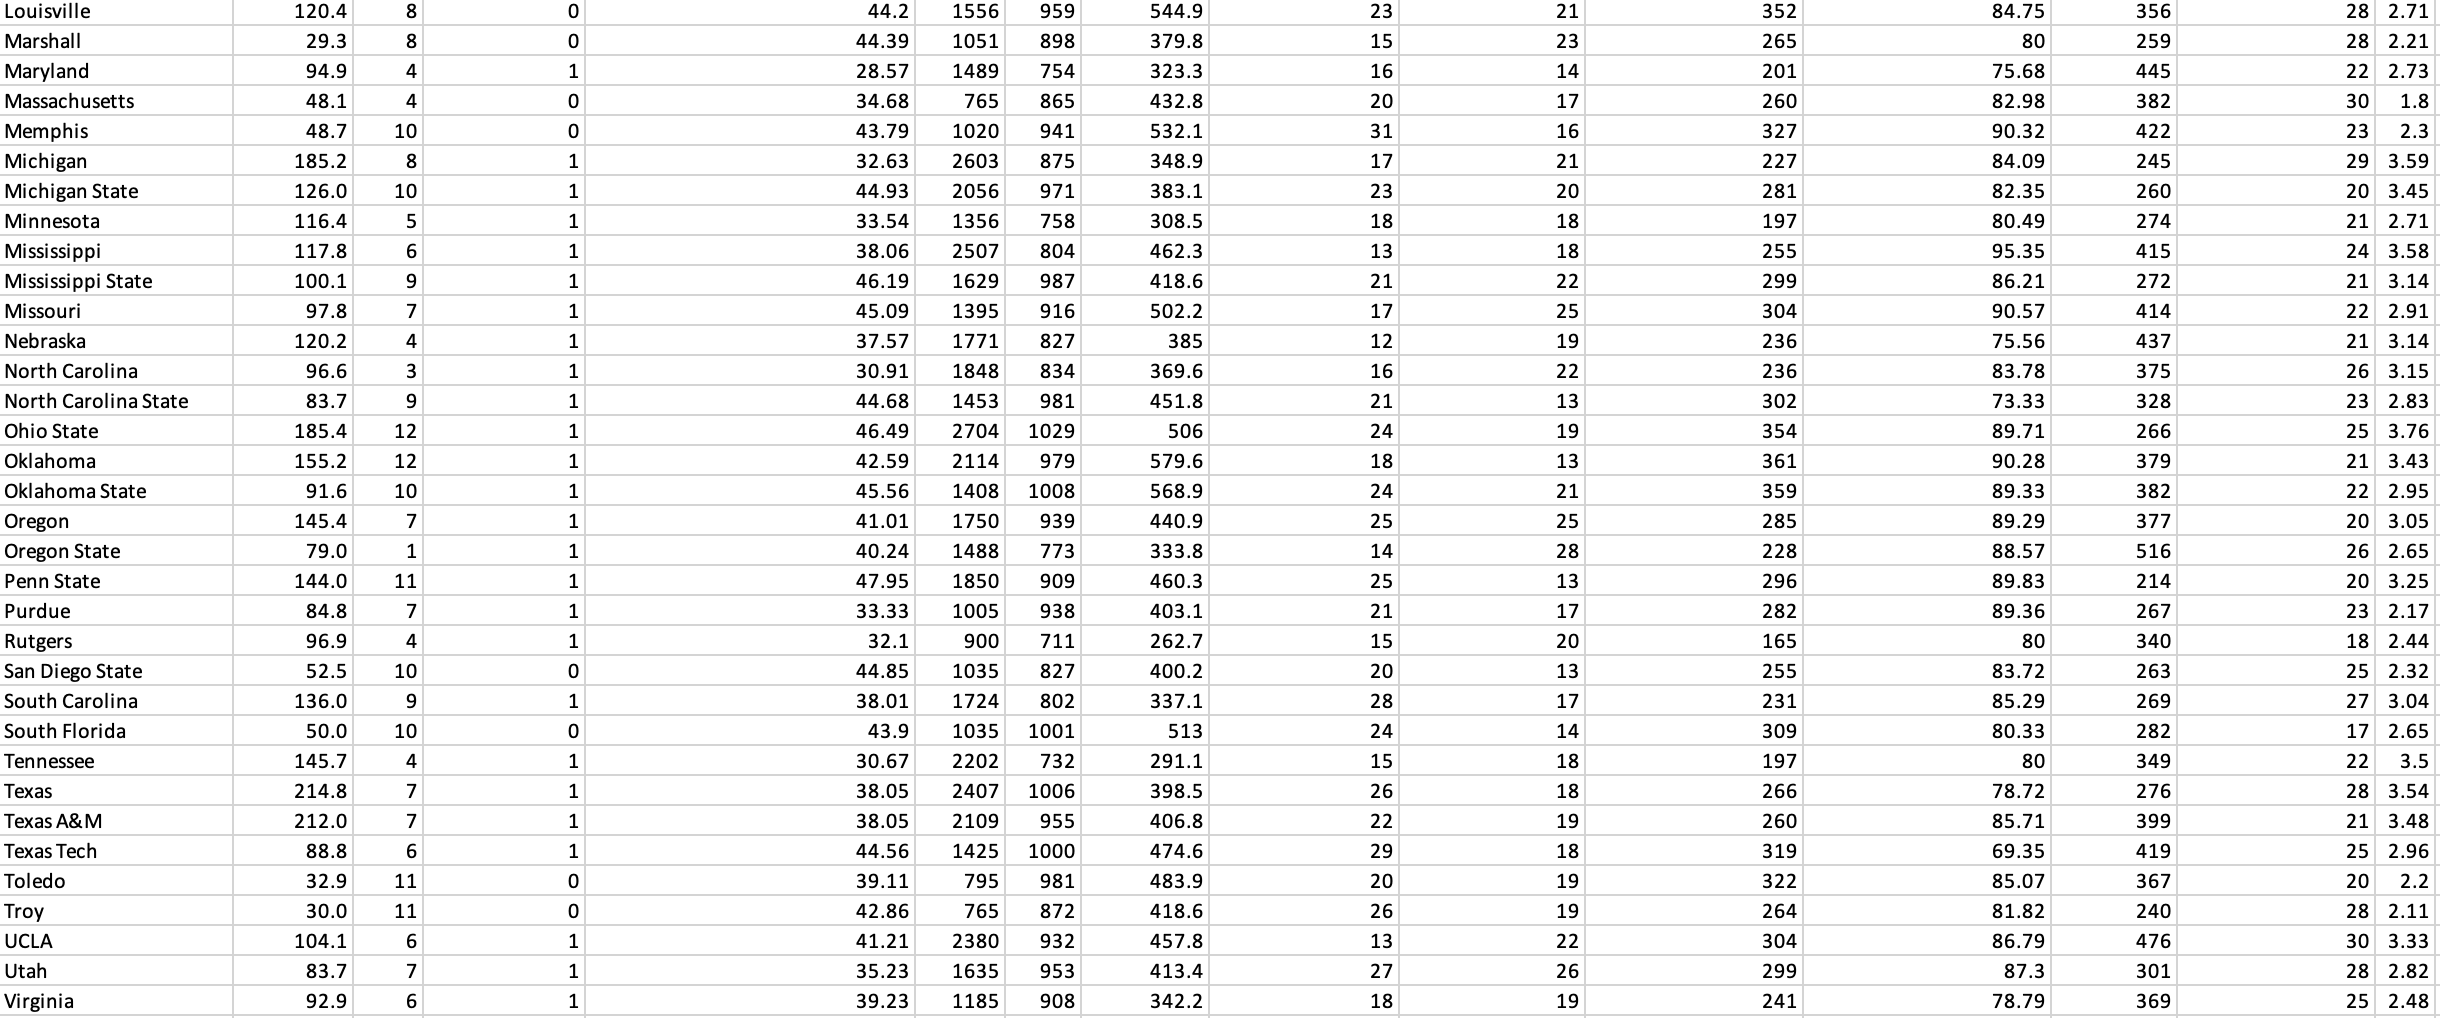

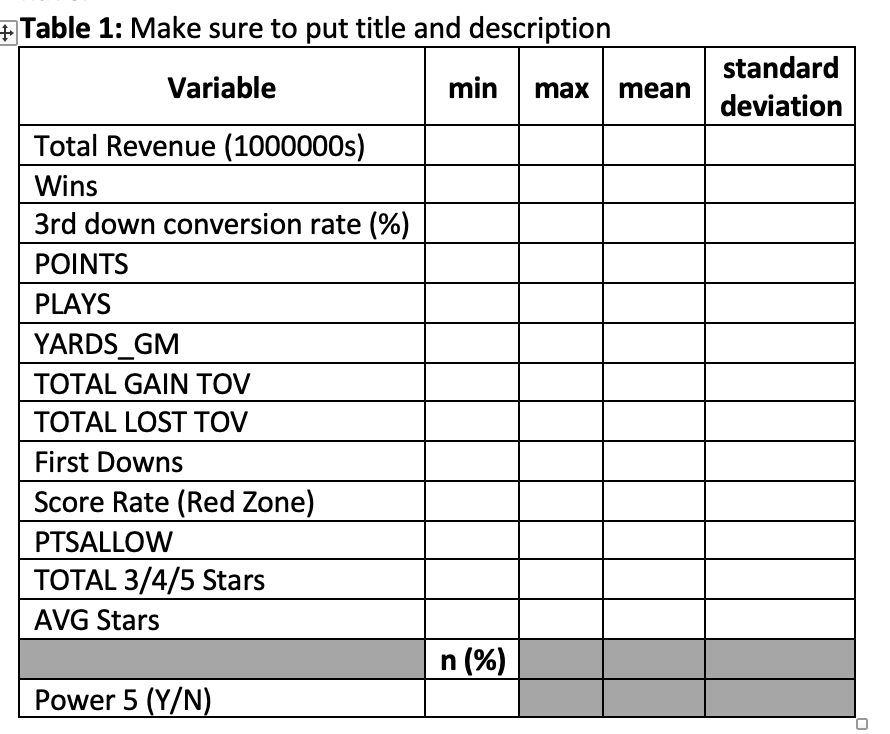
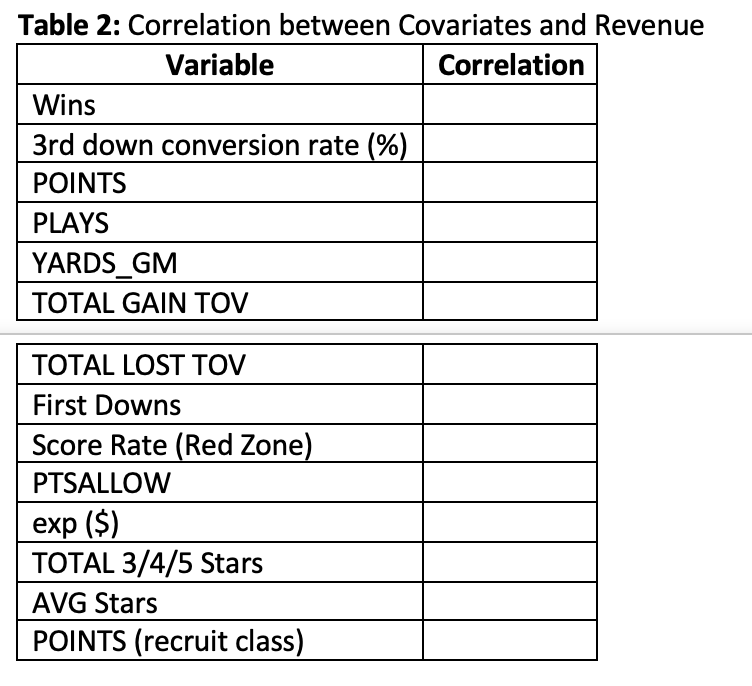
Revenue (in r WINS Power 5 Conferer 3rd down conversion rate (%) Score Rate (Red Zone) Air Force 59.6 48.8 795 908 10 20 290 87.5 389 41 1.98 174.3 13 2885 944 444.1 311 85.29 35.1 40.34 720 386 439.8 26 14 272 84.21 263 22 Appalachian State 91.0 42.26 806 25 22 307 447 20 2.85 101.6 44.71 1650 981 17 15 281 96.23 427 Arizona State 129.7 41.82 1668 802 17 18 238 87.5 434 23 2.91 39.5 780 25 322 71.88 309 Arkansas State 147.5 10 45.45 1024 19 20 312 88.14 259 23 3.65 Boise State 11 45.81 981 406.1 26 13 320 California 40.41 1705 892 384.5 24 20 265 81.63 341 27 Cincinnati 60.5 38.95 236 Clemson 112.6 12 46.33 2530 20 16 309 90.2 190 22 3.59 Colorado 14 14 271 84.09 18 2.61 26 2.31 Colorado State 44.7 50.27 1140 977 18 16 331 85.71 361 East Carolina 48.3 41.21 279 540 Florida 149.2 32.48 712 335.9 17 20 96.77 300 Florida Atlantic 34.5 11 39.67 825 1026 498.4 26 340 318 18 2.28 370 Florida International 43.17 720 890 392.3 18 21 269 97.56 Florida State 144.5 35.19 2816 808 351.9 15 21 234 91.67 276 25 3.72 46.2 LO 35.6 915 952 392.9 21 13 270 88.68 251 157.9 13 45.64 975 435.3 20 16 306 96.36 246 21 3.71 Georgia Georgia Southern 28.9 35.08 945 839 332.3 20 20 210 76.32 386 Georgia Tech 81.8 45.57 1050 751 391.6 10 15 214 88.89 292 18 2.67 57.2 21 23 252 286 Illinois 97.4 33.53 1050 725 19 26 174 88.89 378 106.1 37.91 1215 951 395.8 13 252 304 lowa 34.44 1455 836 329.5 26 19 226 79.59 259 24 2.88 386 20 274 Kansas 95.3 750 851 329 26 93.75 521 36.1 33.33 889 789 23 13 84.62 327 20 Kentucky 130.7 39.29 1702 818 349.8 18 15 242 92.86 367 25 41.38 2545 76.79 246 LSU 147.7 863 411.1 18 260 24 3.54 Louisville\f\f+ Table 1: Make sure to put title and description Variable min max mean standard deviation Total Revenue (1000000s) Wins 3rd down conversion rate (%) POINTS PLAYS YARDS GM TOTAL GAIN TOV TOTAL LOST TOV First Downs Score Rate (Red Zone) PTSALLOW TOTAL 3/4/5 Stars AVG Stars n (%) Power 5 (Y/N)Table 2: Correlation between Covariates and Revenue Variable Correlation Wins 3rd down conversion rate (%) POINTS PLAYS YARDS GM TOTAL GAIN TOV TOTAL LOST TOV First Downs Score Rate (Red Zone) PTSALLOW exp ($) TOTAL 3/4/5 Stars AVG Stars POINTS (recruit class)\f
Step by Step Solution
There are 3 Steps involved in it

Get step-by-step solutions from verified subject matter experts