

Question: The X county supervisor's board has decided that two new volunteer fire stations and ambulance facilities need to be built in the county. The county
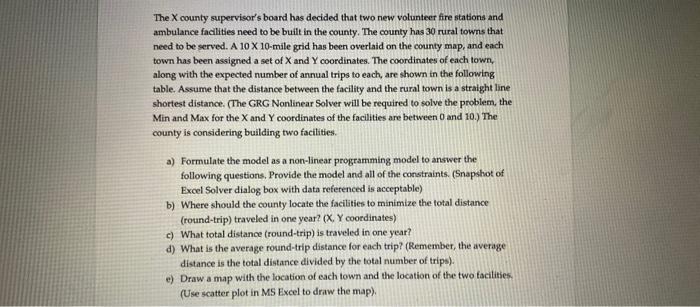
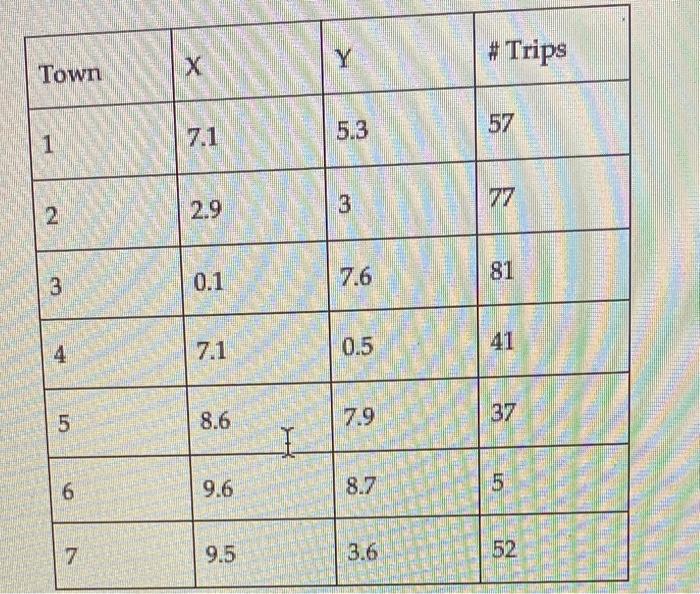
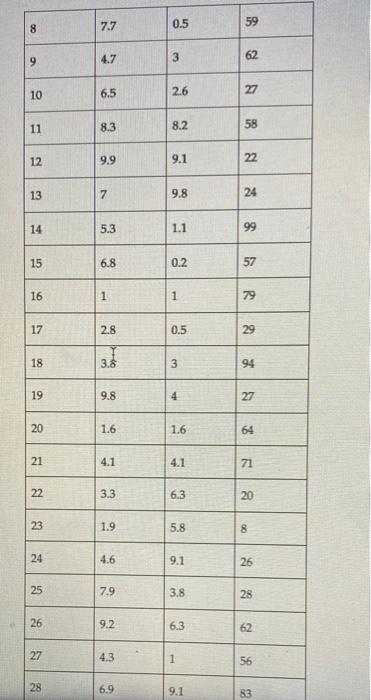
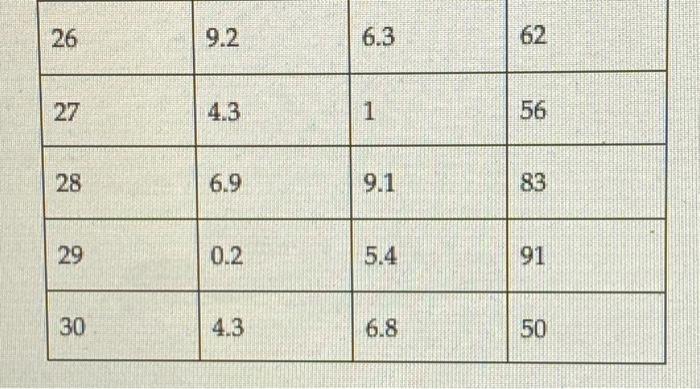
The X county supervisor's board has decided that two new volunteer fire stations and ambulance facilities need to be built in the county. The county has 30 rural towns that need to be served. A 1010-mile grid has been overlaid on the county map, and each town has been assigned a set of X and Y coordinates. The coordinates of each town, along with the expected number of annual trips to each, are shown in the following table. Assume that the distance between the facility and the rural town is a straight line. shortest distance. (The GRG Nonlinear Solver will be required to solve the problem, the Min and Max for the X and Y coordinates of the facilities are between 0 and 10.) The county is considering building two facitities. a) Formulate the model as a non-linear programming model to answer the following questions, Provide the model and all of the constraints. (Snapshot of Excel Solver dialog box with data referenced is acceptable) b) Where should the county locate the facilities to minimize the total distance (round-trip) traveled in one year? ( X,Y coordinates) c) What total distance (round-trip) is traveled in one year? d) What is the average roand-trip distance for each trip? (Remember, the average distance is the total distance divided by the total number of trips). e) Draw a map with the location of each town and the location of the two facilities. (Use scatter plot in MS Excel to draw the map). \begin{tabular}{|l|l|l|l|} \hline Town & X & Y & # Trips \\ \hline 1 & 7.1 & 5.3 & 57 \\ \hline 2 & 2.9 & 3 & 77 \\ \hline 3 & 0.1 & 7.6 & 81 \\ \hline 4 & 7.1 & 0.5 & 41 \\ \hline 5 & 8.6 & 7.9 & 37 \\ \hline 6 & 9.6 & 8.7 & 5 \\ \hline 7 & 9.5 & 3.6 & 52 \\ \hline \end{tabular} \begin{tabular}{|l|l|l|l|} \hline 26 & 9.2 & 6.3 & 62 \\ \hline 27 & 4.3 & 1 & 56 \\ \hline 28 & 6.9 & 9.1 & 83 \\ \hline 29 & 0.2 & 5.4 & 91 \\ \hline 30 & 4.3 & 6.8 & 50 \\ \hline \end{tabular} The X county supervisor's board has decided that two new volunteer fire stations and ambulance facilities need to be built in the county. The county has 30 rural towns that need to be served. A 1010-mile grid has been overlaid on the county map, and each town has been assigned a set of X and Y coordinates. The coordinates of each town, along with the expected number of annual trips to each, are shown in the following table. Assume that the distance between the facility and the rural town is a straight line. shortest distance. (The GRG Nonlinear Solver will be required to solve the problem, the Min and Max for the X and Y coordinates of the facilities are between 0 and 10.) The county is considering building two facitities. a) Formulate the model as a non-linear programming model to answer the following questions, Provide the model and all of the constraints. (Snapshot of Excel Solver dialog box with data referenced is acceptable) b) Where should the county locate the facilities to minimize the total distance (round-trip) traveled in one year? ( X,Y coordinates) c) What total distance (round-trip) is traveled in one year? d) What is the average roand-trip distance for each trip? (Remember, the average distance is the total distance divided by the total number of trips). e) Draw a map with the location of each town and the location of the two facilities. (Use scatter plot in MS Excel to draw the map). \begin{tabular}{|l|l|l|l|} \hline Town & X & Y & # Trips \\ \hline 1 & 7.1 & 5.3 & 57 \\ \hline 2 & 2.9 & 3 & 77 \\ \hline 3 & 0.1 & 7.6 & 81 \\ \hline 4 & 7.1 & 0.5 & 41 \\ \hline 5 & 8.6 & 7.9 & 37 \\ \hline 6 & 9.6 & 8.7 & 5 \\ \hline 7 & 9.5 & 3.6 & 52 \\ \hline \end{tabular} \begin{tabular}{|l|l|l|l|} \hline 26 & 9.2 & 6.3 & 62 \\ \hline 27 & 4.3 & 1 & 56 \\ \hline 28 & 6.9 & 9.1 & 83 \\ \hline 29 & 0.2 & 5.4 & 91 \\ \hline 30 & 4.3 & 6.8 & 50 \\ \hline \end{tabular}
Step by Step Solution
There are 3 Steps involved in it

Get step-by-step solutions from verified subject matter experts