

Question: the zip file: https://www150.statcan.gc.ca1/tbl/csv/32100008-eng.zip A. (1 point) Obtain the Trade Data of monthly export of grains from Statistics Canada's Open Government. See also https://people.math.carleton.ca/~davecampbell/datasets/ 2020/07/24/tradedata-monthly-exports-of-grains-open-canadal.
the zip file: https://www150.statcan.gc.ca1/tbl/csv/32100008-eng.zip
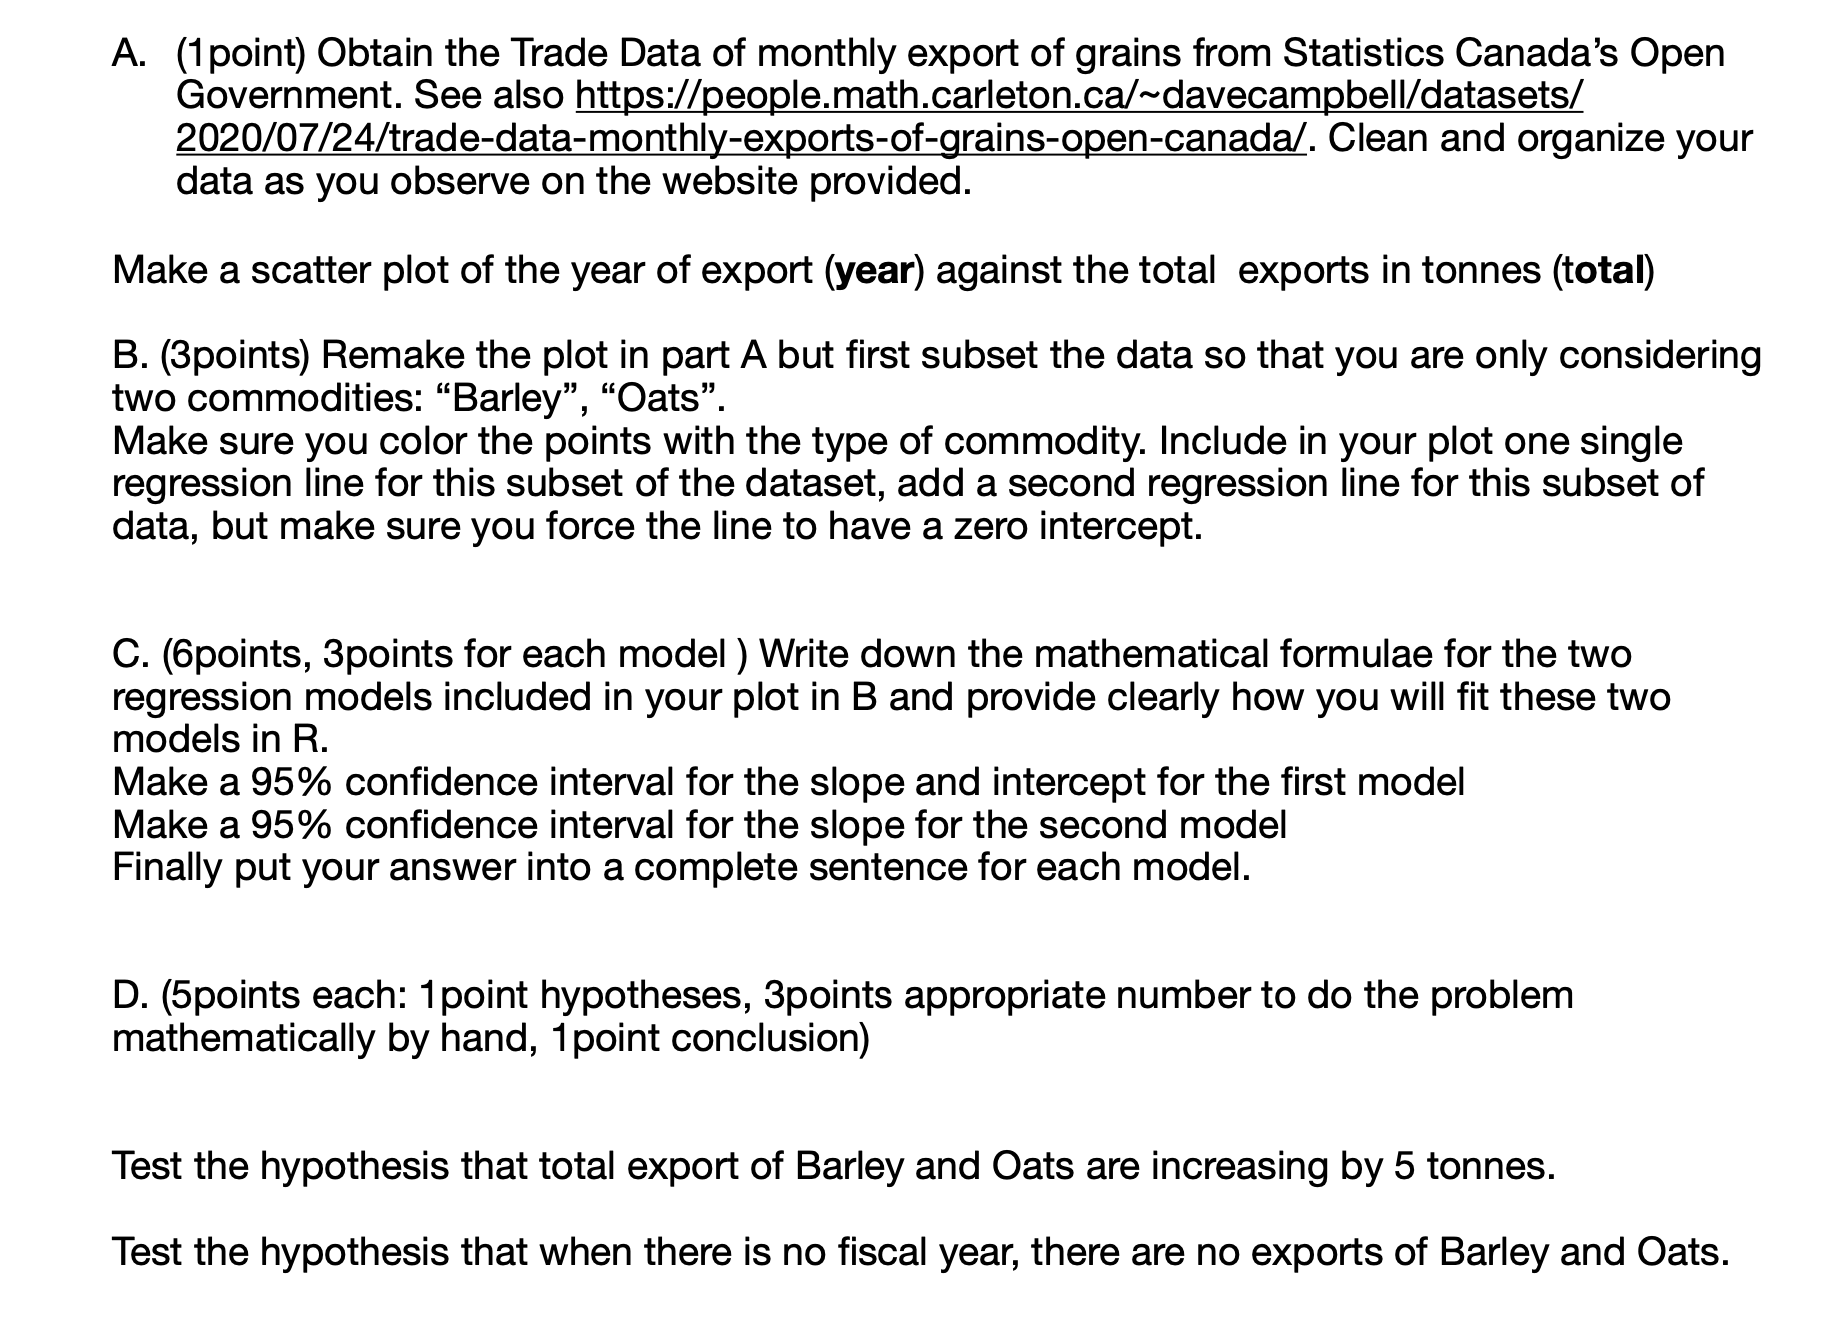
A. (1 point) Obtain the Trade Data of monthly export of grains from Statistics Canada's Open Government. See also https://people.math.carleton.ca/~davecampbell/datasets/ 2020/07/24/tradedata-monthly-exports-of-grains-open-canadal. Clean and organize your data as you observe on the website provided. Make a scatter plot of the year of export (year) against the total exports in tonnes (total) B. (3points) Remake the plot in part A but first subset the data so that you are only considering two commodities: \"Barley\
Step by Step Solution
There are 3 Steps involved in it
1 Expert Approved Answer
Step: 1 Unlock

Question Has Been Solved by an Expert!
Get step-by-step solutions from verified subject matter experts
Step: 2 Unlock
Step: 3 Unlock