

Question: Then I need to analyze the scatter graph. sample calculation: Show a detailed example of how to calculate the slope of the line of best
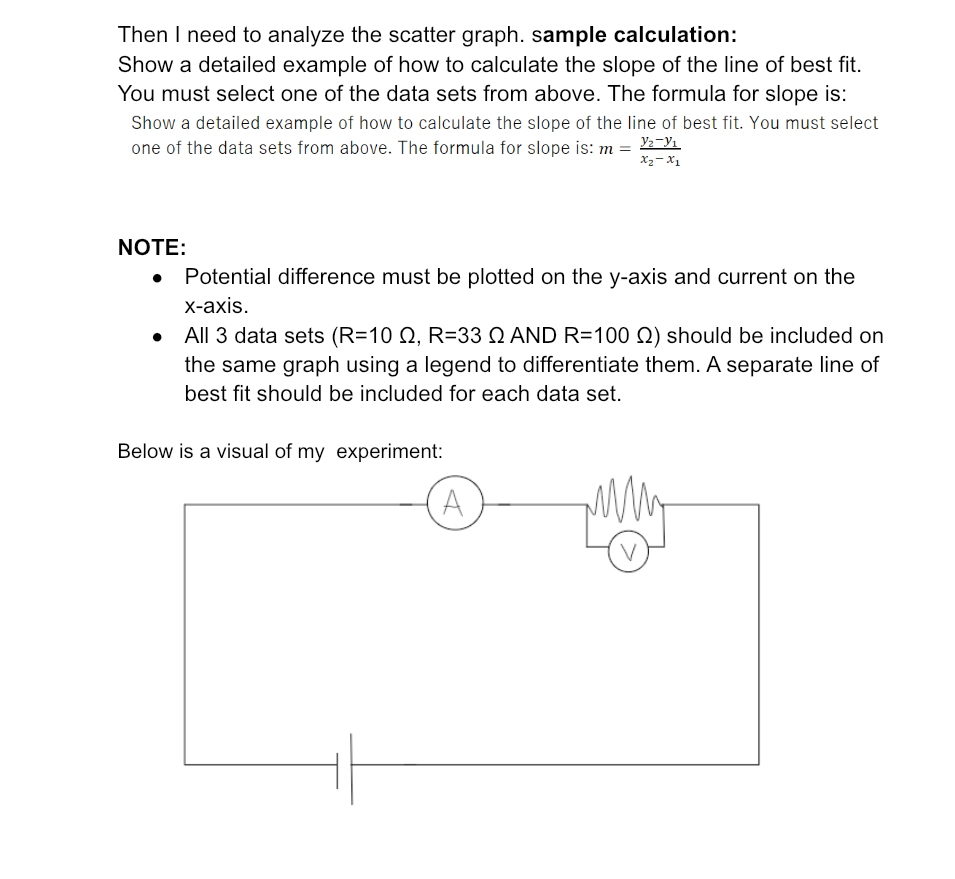
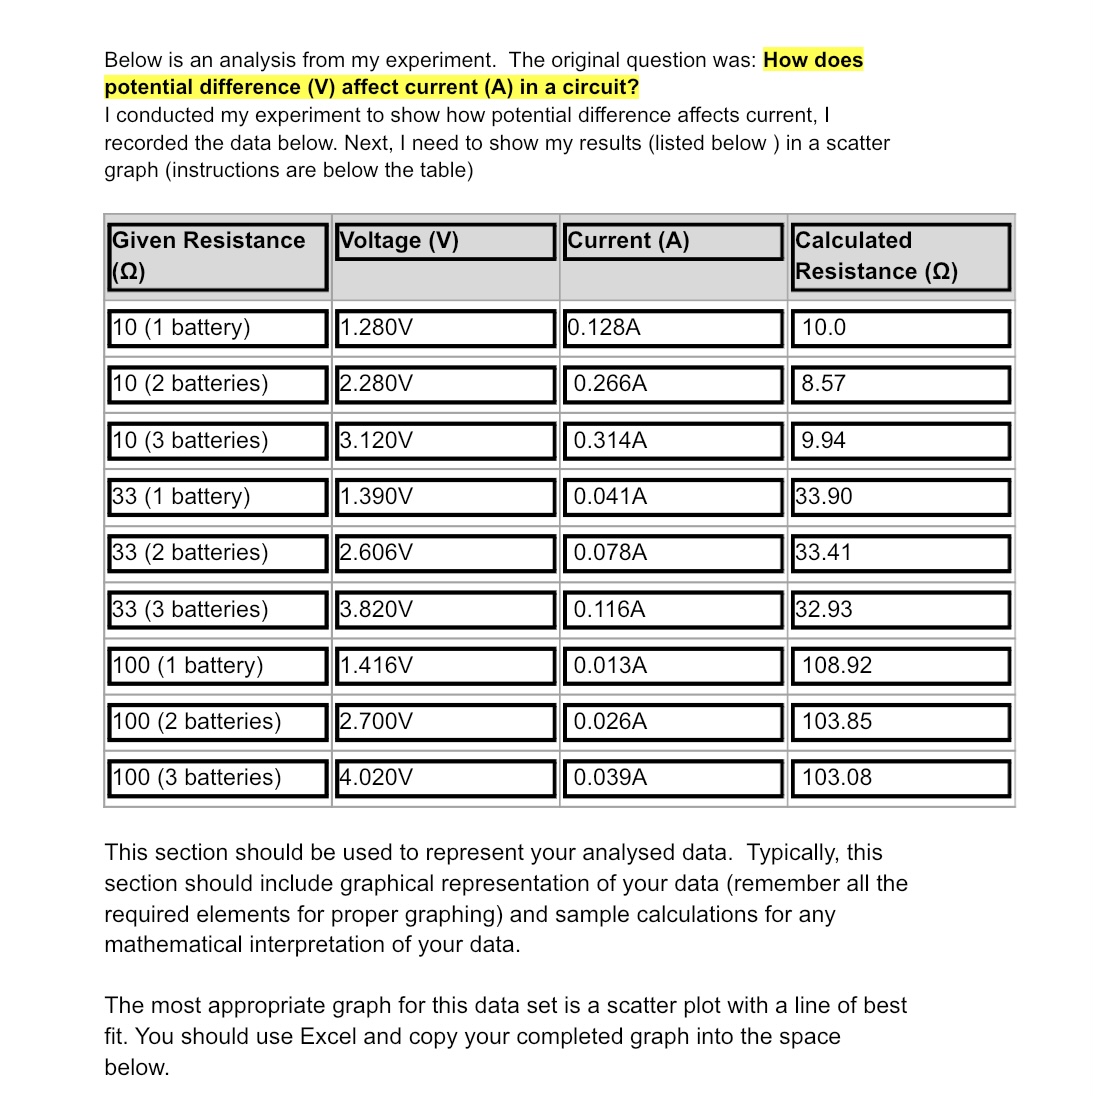
Then I need to analyze the scatter graph. sample calculation: Show a detailed example of how to calculate the slope of the line of best fit. You must select one of the data sets from above. The formula for slope is: Show a detailed example of how to coloulate the slope of the line of best fit. You must select one of the data sets from above. The formula for slope is: m :21? Z ' 1 NOTE: a Potential difference must be plotted on the y-axis and current on the x-axis. o All 3 data sets (R=10 Q, R=33 0 AND R=100 0] should be included on the same graph using a legend to differentiate them. A separate line of best fit should be included for each data set. Below is a visual of my experiment: Below is an analysis from my experiment. The original question was: How does potential difference (V) affect current (A) in a circuit? I conducted my experiment to show how potential difference affects current, I recorded the data below. Next, I need to show my results {listed below ) in a scatter graph (instructions are below the table) Given Resistance oltage (V) Current (A) Calculated (Q) Resistance ((2) This section should be used to represent your analysed data. Typically, this section should include graphical representation of your data (remember all the required elements for proper graphing) and sample calculations for any mathematical interpretation of your data. The most appropriate graph for this data set is a scatter plot with a line of best fit. You should use Excel and copy your completed graph into the space below
Step by Step Solution
There are 3 Steps involved in it

Get step-by-step solutions from verified subject matter experts