

Question: there all one question, but need to explain the colored curves. surpluses 0% deficits year 1 year 2 Refer to the image above. The green
there all one question, but need to explain the colored curves. 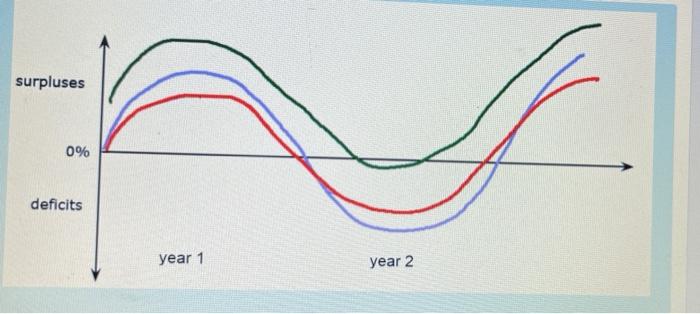

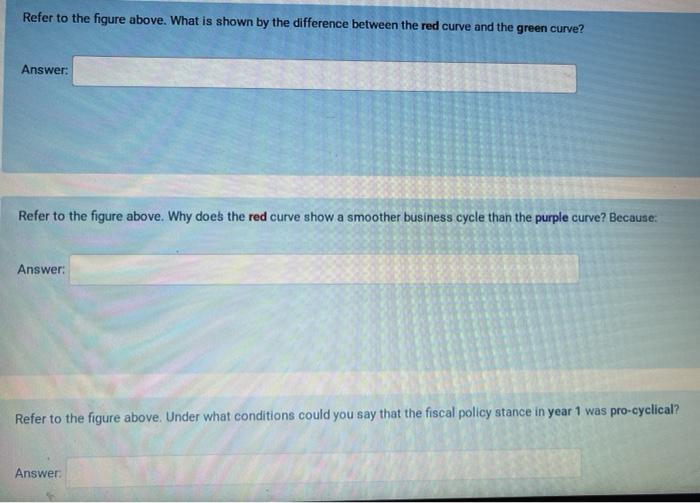
surpluses 0% deficits year 1 year 2 Refer to the image above. The green curve is the: Answer: Refer to the image above. The purple curve is the: Answer: Refer to the image above. The red curve is the Answer: Refer to the figure above. What is shown by the difference between the red curve and the green curve? Answer: Refer to the figure above. Why does the red curve show a smoother business cycle than the purple curve? Because: Answer: Refer to the figure above. Under what conditions could you say that the fiscal policy stance in year 1 was pro-cyclical
Step by Step Solution
There are 3 Steps involved in it
1 Expert Approved Answer
Step: 1 Unlock

Question Has Been Solved by an Expert!
Get step-by-step solutions from verified subject matter experts
Step: 2 Unlock
Step: 3 Unlock