

Question: there are 2 correct answers A waiting line problem that cannot be modeled by standard distributions has been simulated. The table below shows the result
there are 2 correct answers 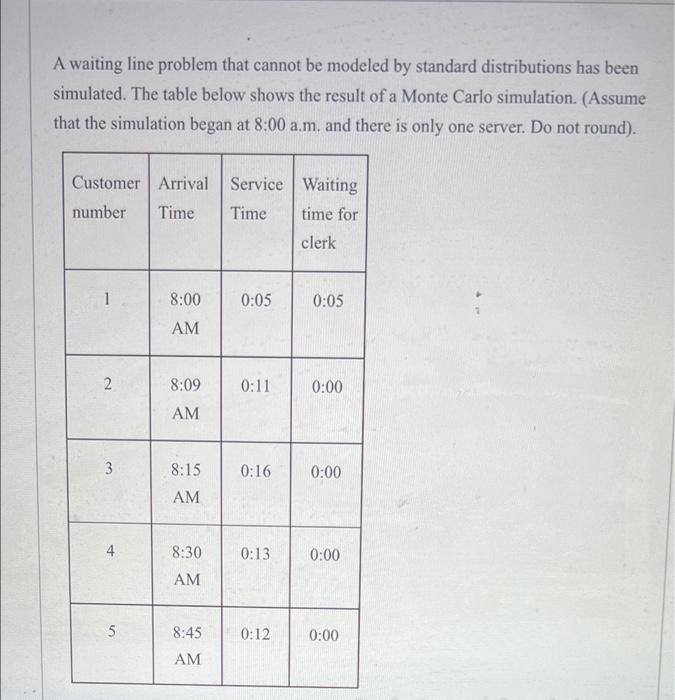
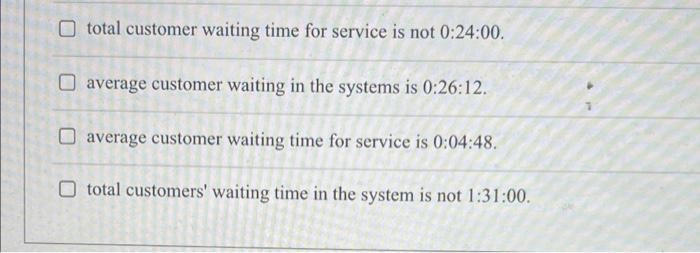
A waiting line problem that cannot be modeled by standard distributions has been simulated. The table below shows the result of a Monte Carlo simulation. (Assume that the simulation began at 8:00a.m. and there is only one server. Do not round). Customer Arrival Service Waiting Time time for number Time clerk 8:00 0:05 0:05 AM 2 8:09 0:11 0:00 AM 3 8:15 0:16 0:00 AM 4 8:30 0:13 0:00 AM 5 8:45 0:12 0:00 AM total customer waiting time for service is not 0:24:00. average customer waiting in the systems is 0:26:12. average customer waiting time for service is 0:04:48. total customers' waiting time in the system is not 1:31:00
Step by Step Solution
There are 3 Steps involved in it
1 Expert Approved Answer
Step: 1 Unlock

Question Has Been Solved by an Expert!
Get step-by-step solutions from verified subject matter experts
Step: 2 Unlock
Step: 3 Unlock