

Question: There are four graphs shown below. Graphs A and B are velocity vs. time graphs. Graphs C and D are acceleration vs. time graphs.
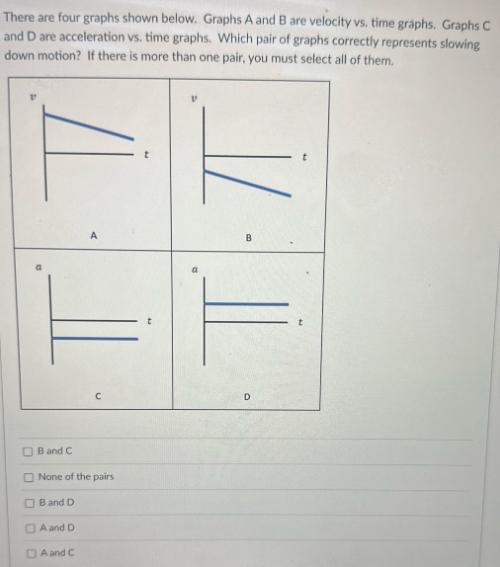
There are four graphs shown below. Graphs A and B are velocity vs. time graphs. Graphs C and D are acceleration vs. time graphs. Which pair of graphs correctly represents slowing down motion? If there is more than one pair, you must select all of them. U Band C A OB and D DA and D A and C None of the pairs B D
Step by Step Solution
There are 3 Steps involved in it
1 Expert Approved Answer
Step: 1 Unlock

The detailed answer for the above question is provided below Answer A and C explanation Veloc... View full answer
Question Has Been Solved by an Expert!
Get step-by-step solutions from verified subject matter experts
Step: 2 Unlock
Step: 3 Unlock