

Question: There are over 2,000 rows in column a, b, and c. I know it would be impossible to get the correct answers without having the
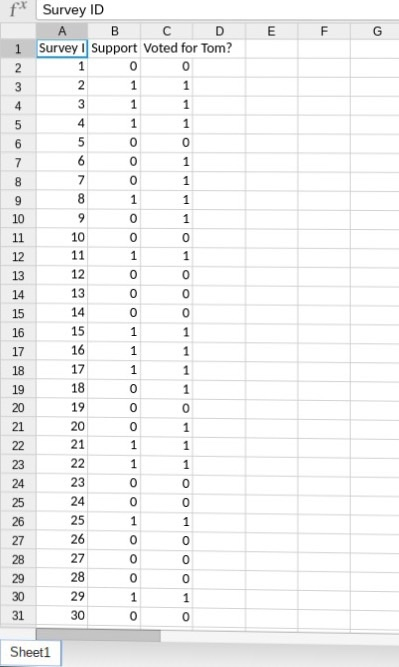
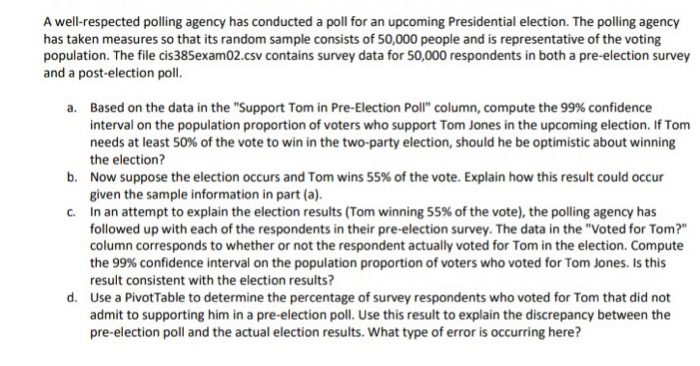
f Survey ID 1 Survey Support Voted for Tom? 10 12 13 14 15 16 17 18 19 14 15 17 18 19 20 21 21 23 24 25 26 27 28 29 25 26 28 31 Sheet1 A well-respected polling agency has conducted a poll for an upcoming Presidential election. The polling agency has taken measures so that its random sample consists of 50,000 people and is representative of the voting population. The file cis 385exam02.csv contains survey data for 50,000 respondents in both a pre-election survey and a post-election poll. Based on the data in the "Support Tom in Pre-Election Poll" column, compute the 99% confidence interval on the population proportion of voters who support Tom Jones in the upcoming election. If Tom needs at least 50% of the vote to win in the two-party election, should he be optimistic about winning the election? Now suppose the election occurs and Tom wins 55% of the vote. Explain how this result could occur given the sample information in part (a). In an attempt to explain the election results (Tom winning 55% of the vote), the polling agency has followed up with each of the respondents in their pre-election survey. The data in the "Voted for Tom?" column corresponds to whether or not the respondent actually voted for Tom in the election. Compute the 99% confidence interval on the population proportion of voters who voted for Tom Jones. Is this result consistent with the election results? Use a PivotTable to determine the percentage of survey respondents who voted for Tom that did not admit to supporting him in a pre-election poll. Use this result to explain the discrepancy between the pre-election poll and the actual election results. What type of error is occurring here? a. b. C. d
Step by Step Solution
There are 3 Steps involved in it

Get step-by-step solutions from verified subject matter experts