

Question: There are some outliers in the data, is that P-value still valid? How would a boxplot influence the result of a hypothesis test? What is
There are some outliers in the data, is that P-value still valid? How would a boxplot influence the result of a hypothesis test? What is the answer to the question?
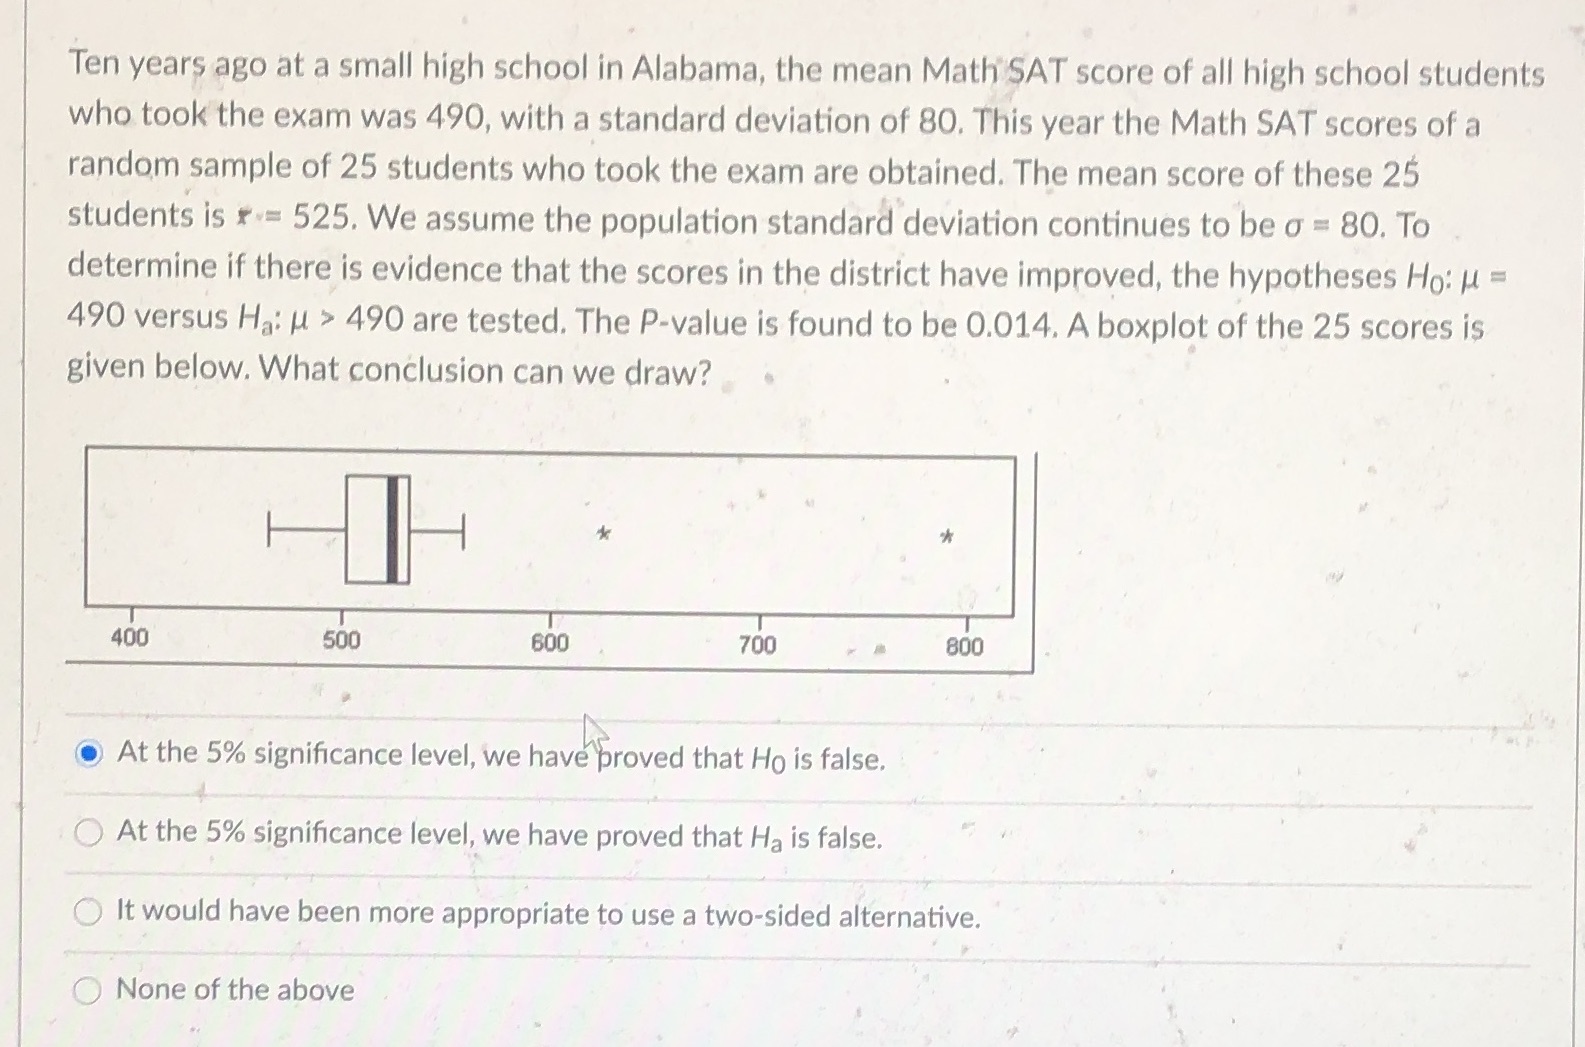
Ten years ago at a small high school in Alabama, the mean Math SAT score of all high school students who took the exam was 490, with a standard deviation of 80. This year the Math SAT scores of a random sample of 25 students who took the exam are obtained. The mean score of these 25 students is r = 525. We assume the population standard deviation continues to be o = 80. To determine if there is evidence that the scores in the district have improved, the hypotheses Ho: H = 490 versus Ha: H > 490 are tested. The P-value is found to be 0.014. A boxplot of the 25 scores is given below. What conclusion can we draw? 400 500 600 700 800 At the 5% significance level, we have proved that Ho is false. At the 5% significance level, we have proved that Ha is false. It would have been more appropriate to use a two-sided alternative. None of the above
Step by Step Solution
There are 3 Steps involved in it

Get step-by-step solutions from verified subject matter experts